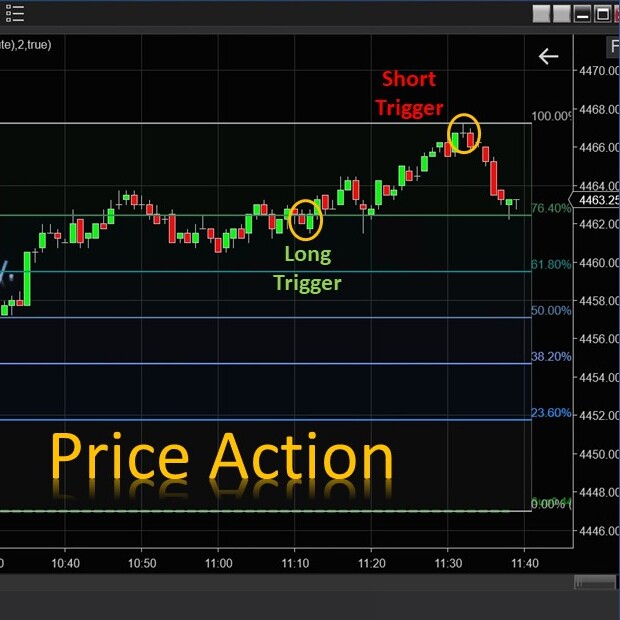
The E.G. Price Action is automatically integrated with the E.G. Trigger Point presented on your chart to generate short and long signals for you. It recognizes Price Action opportunities and generates arrows presented on your chart and sound notifications.
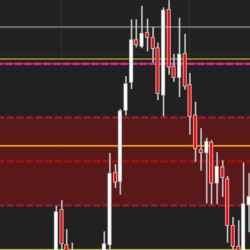
The “opening range” is the range obtained from the highest and lowest price of a security during the first minutes of daily trading activity. The JATS Opening Range Indicator displays the OR and the current open of the RTH session for a defined time period, as well as the pre-session Globex.
Daily Levels plots important levels such as prior days open/high/low/mid/close, overnight high/low/mid, IB high/low and more! It also displays historical probabilities of price touching each level in regular and overnight sessions for the most popular futures products.
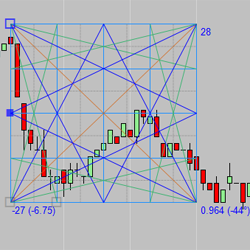
The IT_GannBox tool is fully loaded for chart analysis price prediction. This tool has all types of visual features and three modes of operation. Industry standard Fixed Ratio and FreeForm modes plus the custom FreeForm Ratio mode. Adding the IT_ChartSquare tool will allow visually accurate angles.
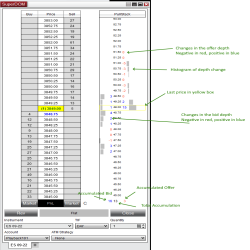
The Pull Stack Super DOM column shows you changes in the order book. There are several modes to this indicator to help give you a nuanced view and find the state of the market at each price level.
Channel VA MNTrader is a fully automated trading system. Trading is based on Renko strategy using a Keltner Channels indicator. The filtration system is based on the ADXVMA & the MACD indicator. It has an improved position support system with flexible settings that will improve trading consistency.
Automated trading for the S&P 500, Indices, ETFs, Stocks and Cryptocurrencies. Discretionary trading indicators. The RD3 uses a two stage system for identifying profitable swing trading opportunities.
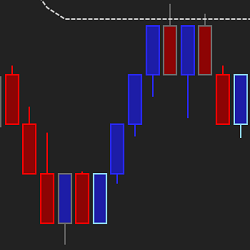
Track volume profile in three timescales easily! Optimal Vision analyses point of control and value area breakouts in three rolling lookback periods of your choice and color-codes your bars by strength of signal. A simple way to bring dynamic volume profile to your trading! Strategy compatible.
Become a full access member to all of thei exciting services. Membership includes: Trade room access, software activation for up two computers, and thei Daily Market Movers trade reports.
The Lighthouse Trading strategy works fully automatically in the futures market. The algorithm analyses time and sales, volume, rhythm and acceleration in real time. Its objective is to search for patterns to help determine who controls the market.
December 2, 2024
Mastering Sideways Markets With Auction Bars and Range Projections
November 19, 2024
Enhancing Your Automated Trading System: Key Insights from Best Pro Trade
November 14, 2024
NinjaTrader New Ecosystem Tools: October 2024 Edition
Enter Email for Updates