The Roller Coaster is a Stochastic/MACD cross indicator with special EMA Points of Control for both long and short trades. Our algorithm works everything out behind the scenes, keeping your chart clean.
Uniquely streamlines your daily trading tasks, automating processes that would otherwise require manual effort. Organized into four key sections — first entry, second entries, auto stops and auto exits. Plus more.
Custom design. Custom actions. Create buttons that interact with standard NinjaTrader ATM strategy orders. Fully customizable, including button and font color and size as well as button width and position. Actions can be based on a wide variety of reference prices and offsets.
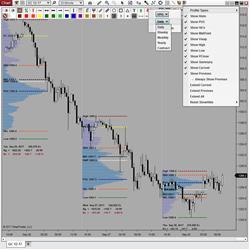
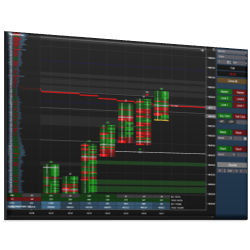
Volume Profile Sessions features 5 Profile Durations (Daily, Weekly, Monthly, Yearly, Contract) and 3 Modes of Calculation (bar/min/tick). It displays 8 Levels of Significance (VPOC, VA's, VWAP, High/Low/Mid, PClose) & session summaries, and provides simple configuration thru a toolbar icon!
In this course you will learn how to code add-ons for NinjaTrader 8. It consists of over 10 lectures on how to create custom windows, pass data from strategies into add-ons, create beautiful charts using 3rd party libraries and use statistics to find new ideas for building systems.
Instantly receive clear buy and sell signals in real-time, simplifying trading decisions. Enhance trading strategies by knowing exactly when to enter and exit positions.
Free daily newsletter - global news & views; free weekly YouTube (Sunday) to prepare you for the week ahead; 1-day workshops; 1-week courses zero to hero; accredited masterclass financial & commodity trading; flexi-masterclass, which includes a free trading challenge; and trader mentoring.
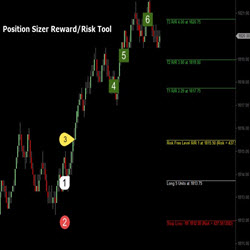
This tool auto-calculates position size based upon account value and percentage risk parameters input by trader. Displays the Entry Price, Stop Loss, and up to Three (3) Price Targets based on R-values. If you a serious trader, then this is an essential addition to your trader toolbox.
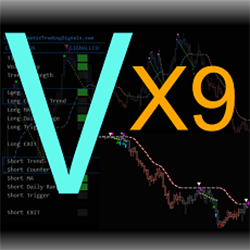
High performance, fully-automated night and day trading for NQ and MNQ. The VX9 wakes up before sunrise and finds the best trading opportunities in the morning twilight. Built from scratch to be a true day trading system, the VX9 offers simplicity and performance.
This indicator plots signals, targets, and stops based on support and resistance from various moving average types. The trend is established based on a minimum number of bars above or below the moving average. The signal is initiated on the first touch of the moving average.
December 2, 2024
Mastering Sideways Markets With Auction Bars and Range Projections
November 19, 2024
Enhancing Your Automated Trading System: Key Insights from Best Pro Trade
November 14, 2024
NinjaTrader New Ecosystem Tools: October 2024 Edition
Enter Email for Updates