Everything you need to know about consistent trading video tutorial course. This course covers the following: How to use the Metatrader4 trading app, market Analysis (Fundamentals & Technicals), risk management, trading psychology (trading plan, journal, management, goal, etc.)
Curious about NinjaTrader 8's supplied indicators, or seeking detailed information about them? Follow this link for an in-depth exploration of each indicator, providing you with the knowledge you need for effective trading. Dive into comprehensive insights now!
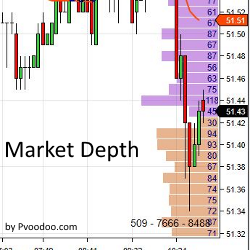
The addition of Market Depth indicators allow traders to see the bid/ask data based on price in real time. Similar to the Level II data featured in the NinjaTrader SuperDOM, the Market Depth Indicator plots bid/ask data directly on a chart. Learn more!
Get all of the most critical indicators in one package. Market Levels provides VWAP, Value Area High/Low, Point of Control, Initial Balance, Open, High, Low, Close and more helping you identify key price areas. Levels are plotted for the full session and a user customized session.
Hey Overachiever, I see you! Don’t worry—you’re in the right place. You’ve made a habit of outperforming, so why not arm yourself with the best team to help continue your winning streak? We code (like hackers) and launch (like marketers) your products. Click and schedule a free consultancy call.
Join this team of professional traders and mentors as they identify trades in real time (US / open & close NQ & ES).
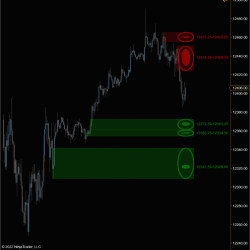
Patented! 'UFOs' stands for UnFilled Orders. Intelligent technology saves time and adds precision when planning entries and exits. Identify buy and sell UnFilled Orders in all markets and timeframes. Answers the question, “What is potentially an intelligent buying price or selling price?”
Predict the ultimate stop level using the sophisticated NSR Triple STX, which performs over a million calculations per bar. Measure the trend strength using the non-arbitrary Ocean math with the BTX indicators. Includes Ocean Classic. Sign up for a 30 day free trial!
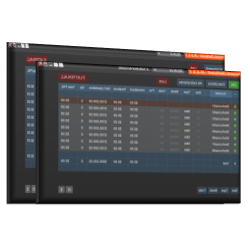
Save money by purchasing the Ultimate Account Management Bundle for NinjaTrader! This all-in-one solution combines their premiere Duplicate Account Actions trade copier and their top-rated Account Risk Manager at a better price!
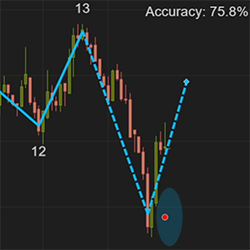
AiWave is a cutting-edge Artificial Intelligence powered tool that provides real-time market reversal forecasting. It empowers traders with valuable insights into market movements, enabling them to make more informed decisions and potentially improve their trading outcomes.
December 2, 2024
Mastering Sideways Markets With Auction Bars and Range Projections
November 19, 2024
Enhancing Your Automated Trading System: Key Insights from Best Pro Trade
November 14, 2024
NinjaTrader New Ecosystem Tools: October 2024 Edition
Enter Email for Updates