A catalog of tools for traders available through subscription plans, offering a comprehensive set of features for enhanced trading. Access strategies, indicators, and other solutions designed to help you trade more effectively in the market.
Free trading psychology masterclass. Learn the complete trading psychology system to overcome destructive trading habits and reach pro-level consistency in as little as 8 weeks (even if you are starting with zero willpower and breaking your rules every time you trade). Register today!
This tool uses price action, trend and momentum to identify price zones (TrapZones) and price bars (TrapBars) where traders can get trapped in the market. Trade good setups while avoiding bad trades e.g. FOMO, catching a falling knife, or fighting the trend, using automated technical analysis!
Learn to flow with the market using a personalized and simplified strategy. This course includes a complete written and video curriculum with detailed homework reviews. One-on-one coaching and student-only groups to build confidence, consistency, clarity, connection and community.
Indonesian-speaking. This channel is a place to learn forex, crypto and stock trading using ICT methods. Make daily analysis, design trading plans correctly and measurably.
Precision Divergence Finder is designed to find bullish divergences in Demand Index readings in real time with no delay or re-painting. It can often pinpoint precise market bottoms and using this product can give you the insight needed to increase the chances of finding the exact market low point.
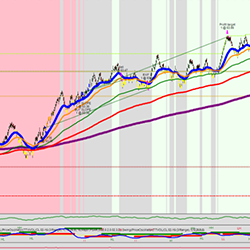
A comprehensive Automated System including 20 strategies covering a broad range of instruments and market conditions. Includes indicators, color backgrounds, and a powerful money management module to protect profits and principal. Learn more.
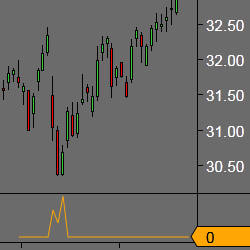
Download a 14-day test period of this trading indicator that identifies points to enter the market for price pullbacks and reversals. The indicator uses pure price action, which makes it possible to get rid of lagging indicators. Be independent of the values and stage of the market.
VWAP MNTrader strategy is a fully automated trading system. Trading is based on the VWAP indicator for the daily, weekly and monthly periods on the breakdown test strategy with a filtering system. It has an improved position support system with flexible settings to improve trading consistency.
Find out how you can identify accumulation and distribution with price action trading. Spot the footprints left by “smart money” with price and volume, the Wyckoff method way, when day trading or swing trading the stocks and futures. Join today and be part of the lifetime community group.
December 2, 2024
Mastering Sideways Markets With Auction Bars and Range Projections
November 19, 2024
Enhancing Your Automated Trading System: Key Insights from Best Pro Trade
November 14, 2024
NinjaTrader New Ecosystem Tools: October 2024 Edition
Enter Email for Updates