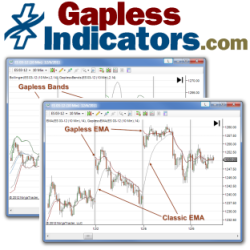
Never worry how an opening price jump or drop affects your favorite classic indicator (MACD, Stochastics, EMA, ATR, etc.). Gapless Indicators are enhanced versions of 15 classic technical indicators that self-adjust in real-time to any opening gap (aka overnight gap).
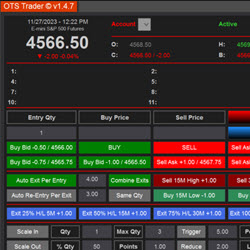
Uniquely streamlines your daily trading tasks, automating processes that would otherwise require manual effort. Organized into four key sections — first entry, second entries, auto stops and auto exits. Plus more.
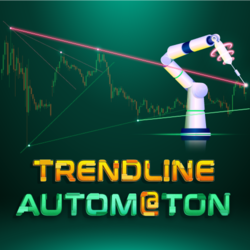
Unlike typical indicators that often succumb to false breakouts, Trendline Autom@ton eliminates such errors, with trendlines extending until a genuine breakout occurs as defined by the user. The indicator supports an unlimited number of trendlines, providing a detailed view of price dynamics.
Get Integrated Basic and Advanced Training in a full-year trader development program. This program includes access to live online Basic and Advanced Training events in addition to on-demand learning modules. Designed for those who can commit to 1-3 hours of trader development per day.
With decades experience as an active trader & accredited coach, Mandi understands what it takes to build a successful trading career. She specializes in coaching HedgeFund, Prop, Bank & Private Traders around the globe in the essential mindset aspects of trading.
We provide an all-in-one fully-featured automated trading strategy ready to trade any market (Futures, Stocks, Forex). We deliver the utmost reliability and frequently release new features free of charge. Schedule your FREE demo today and see how our members have boosted their trading performances.
If time is important, the Nison Candle Scanner (NCS) experts can install and customize NCS software for traders. NCS White Glove Service is a fast and easy process to remotely configure NCS on any trading computer anywhere in the world. Register now to save time and focus on trading.
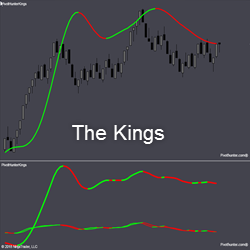
THE KINGS include King 1, 2, 3, and 3Kings. They measure order flow at 3 levels, then combine all three into one - The 3Kings. The bottom panel shows Kings 1, 2 & 3. The top panel shows them combined into The 3Kings. This provides traders with a very smooth indication of order flow.
The Lighthouse Trading strategy works fully automatically in the futures market. Besides trading in different markets simultaneously, you can configure it in distinct ways in each one of them. The algorithm analyses time and sales, volume, rhythm and acceleration in real time.
Trend Friend is a simple indicator designed to identify when the price in different time periods is aligned with select moving averages. It is not a closed methodology to operate but you can establish two systems to use this indicator: aggressive operation to paint signals or wait for a retracement.
December 2, 2024
Mastering Sideways Markets With Auction Bars and Range Projections
November 19, 2024
Enhancing Your Automated Trading System: Key Insights from Best Pro Trade
November 14, 2024
NinjaTrader New Ecosystem Tools: October 2024 Edition
Enter Email for Updates