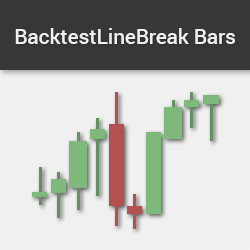
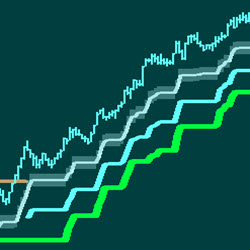
The Line Break Bar is one of the most effective ways to reduce chart noise. It provides accurate back-testing results by showing the correct open prices and restoring the wicks. Easily recognize divergence & price action patterns & eliminate noise from traditional minute charts. Get started today!
Experience first-hand how Touch Zone Trading identifies opportunities & manages trades. Whether you’re trading part-time or full, you’ve got to be ‘in the zone’ to perform. Are you a good fit for the Touch Zone Trade Room? Take the trader survey!
This is a machine learning/price action-based automated scalping algo. It runs on a custom bar type with multiple price action algos to choose from. Custom control panel allows the trader to control and manipulate the strategy while its running and also manage multiple strategies at once.
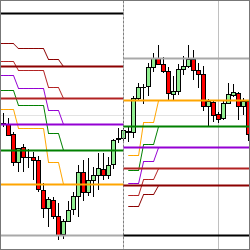
The Lucrum Fibonacci Retracement/Extension indicator is a tool that calculates the respective Fibonacci retracement levels based on the peaks and valleys of a range bound deviation indicator. Identify key price points to project future and past support and resistance levels.
Do you want to know the trading setups we use? Create your own profile FREE on our website and you’ll have access to our course videos where we explain each of our patterns. Gain the knowledge to access our EPyF Trading Room and learn our way of understanding the market.
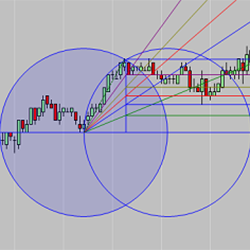
Attention Fibonacci, support/resistance, Gann & market structure enthusiasts! The HarmonicFan draws an A-B line & 2 intersecting arcs are calculated. The upper or lower half of the resulting Vesica Piscis formation is then divided into Fib levels & trend lines are then created as a fan. Learn More!
The ATR Stop is a simple but powerful tool to help the trader stay in a position longer and with greater confidence. Employs a proprietary “filter” to eliminate “false positives.” PTG ATR Stop Indicator is your confidence builder. Ask about PTG's Auto-Trade Assistant (ATA) Strategy.
By subscribing to our Indicator Spotlight traders get a free monthly download from the LizardIndicators indicator library. All indicator features are documented with an explanation on how the indicator can be used in a trading strategy. Sign up today!
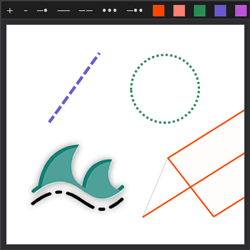
This indicator allows the user to change the color, stroke style and stroke size of drawn objects on the fly without having to dig through various menus. This increases application functionality and user charting efficiency.
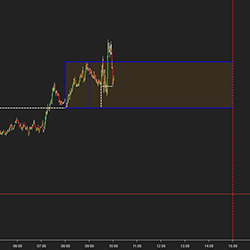
Add the visual benefit of displaying the session open value (settable). Build a visual range of any timeframe you choose. For example, the first 30 minutes of the market open or an hour before the market opens. Choose the end time for a range to stop displaying for the day.
December 2, 2024
Mastering Sideways Markets With Auction Bars and Range Projections
November 19, 2024
Enhancing Your Automated Trading System: Key Insights from Best Pro Trade
November 14, 2024
NinjaTrader New Ecosystem Tools: October 2024 Edition
Enter Email for Updates