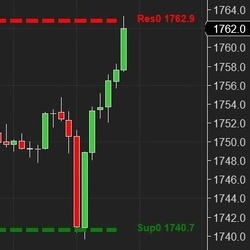
Based on an Artificial Intelligence (AI) engine, the E.G. Trigger Point calculates support and resistance (S&R) lines. The S&R are specific price points on a chart expected to attract the maximum amount of either buying or selling.
Instantly receive clear buy and sell signals in real-time, simplifying trading decisions. Enhance trading strategies by knowing exactly when to enter and exit positions.
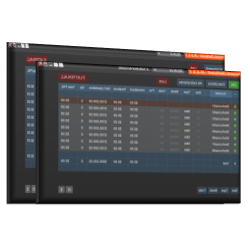
Tradesyncer is a powerful trading solution that synchronizes all your futures (prop firm) trading accounts across multiple brokers, platforms, and data feeds. This dashboard lets you monitor and manage your trade data, ensuring efficiency and insights from one centralized location.
Save money by purchasing the Ultimate Account Management Bundle for NinjaTrader! This all-in-one solution combines their premiere Duplicate Account Actions trade copier and their top-rated Account Risk Manager at a better price!
The Lighthouse Trading strategy works fully automatically in the futures market. Besides trading in different markets simultaneously, you can configure it in distinct ways in each one of them. The algorithm analyses time and sales, volume, rhythm and acceleration in real time.
Entry Signals from TREMPER.com generates entries based on proprietary internal conditions. It allows you to manage your position based on chart size and your parameters.
Signals are produced by an imbalance of prices between sessions, a principle of markets based in physics. You have the potential of 1 trade per day, automated from start to finish and designed to be monitored in some capacity. Users have full control of strategy parameters.
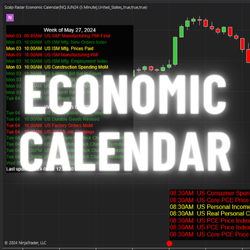
Stay ahead of market-moving events with this comprehensive news agenda, displaying upcoming events like CPI, PPI and Jobs data categorized by impact. Event marker are drawn directly on your chart with hover-over features. Filter by country, impact, or event name to optimize your trading strategy.
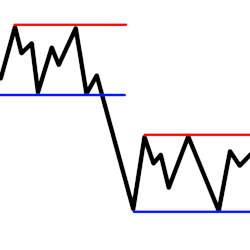
Created to help aid momentum-style charting in finding support and resistance lines. It was specifically made for the ES when plotted with tick bars. This tool may help cut down on chart preparation time or get your chart caught back up if busy multi-tasking.
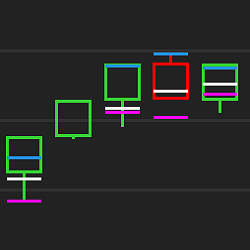
Are you using Renko/range/tick/volume bars? Optimal Tempo shows you the high/low/close of time-period bars overlaid on your chart. Choose any time period you wish. See five-minute bar levels overlaid on a Renko chart! No need to watch other charts. Strategy compatible.
December 2, 2024
Mastering Sideways Markets With Auction Bars and Range Projections
November 19, 2024
Enhancing Your Automated Trading System: Key Insights from Best Pro Trade
November 14, 2024
NinjaTrader New Ecosystem Tools: October 2024 Edition
Enter Email for Updates