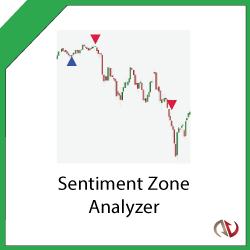
Use the Sentiment Zone Analyzer to measure overall market sentiment to spot trend reversals early! Based on the premise that extremely bullish or bearish tendencies will eventually lead to trend reversals. Dynamically calculates overbought and oversold levels based on previous price action.
Unlock the power of fully automated NQ and MNQ futures trading with Steady Turtle. This advanced trend-following strategy adapts to market momentum and volatility, offering precise, emotion-free execution with robust risk management.
Q-GZone provides visual gap zones between the bars. Gaps occur when a significant imbalance exists between buy and sell orders. It can lead to a gap in the price as the market seeks to match these orders. The market tends to return to and fill in these gaps.
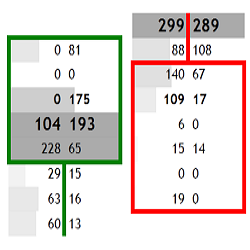
Volume Ladder allows traders to display bar intrinsic, tick level volume and bid-ask information in neat and clean format. Various visual customizations are available to suit a variety of uses. This is an essential tool for order flow analysis, and market/volume profile structure traders.
Get educational swing trading ideas for the Micro Emini S&P 500 and Micro Emini Nasdaq futures. These are real-time swing trading ideas that are posted to a private Telegram group for all users to read. Dynamic risk and position management are also included.
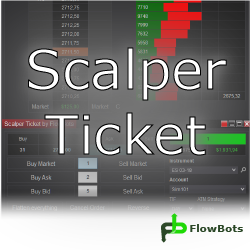
Scalper Ticket was made to facilitate and improve the performance of scalping operations by gaining speed in quantity changes at the bid/ask levels. It shows the first book line, position average price and the PnL with commissions cost. A perfect match to use in conjunction with the SuperDOM.
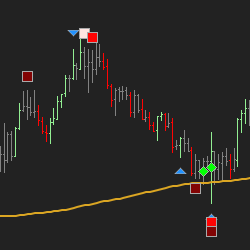
The Price Action Analyzer helps identify and alert price action events when the market enters your reversal area. This tool supports Hidden Gap Bars, Inside/Outside Bars, Up Thrust and Spring, No Demand and No Supply, Effort to Rise, Effort to Fall and Stopping Volume!
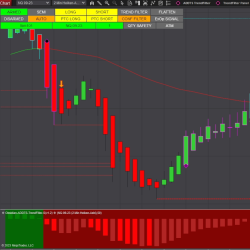
Level up your trading with the ADDTS! A cutting edge tool for NinjaTrader 8, featuring auto/semi auto functionality and customizable entries/exits. Filters trends, confirmed/unconfirmed signals and includes audio alerts. Compatible with Renko, Heikin Ashi bars. Start your 7-day free trial now.
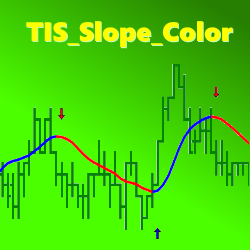
The TIS_Slope_Color indicator allows traders to detect the slope change of any line from any indicator. It can then paint the line, the background, or paint entry signals on a chart.
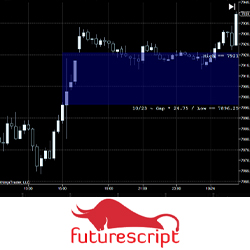
The Gap indicator was designed to illustrate when dramatic price disconnects from one period to the next when the market establishes critical levels. This indicator has been carefully constructed to explore different perspectives and trading approaches related to the gap in intuitive ways.
December 2, 2024
Mastering Sideways Markets With Auction Bars and Range Projections
November 19, 2024
Enhancing Your Automated Trading System: Key Insights from Best Pro Trade
November 14, 2024
NinjaTrader New Ecosystem Tools: October 2024 Edition
Enter Email for Updates