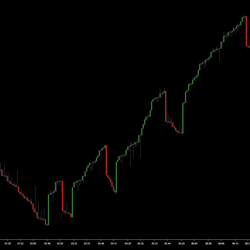
The LogikDeltaRenko is a unique Cumulative Delta based bartype with Renko like trend and reversal attributes. It fuses market price with buyer vs seller volume, granting maximum ability to maintain the underlying market sentiment while minimizing volume based reversal lag.
Universal Oscillator is an indicator that operates on the general principles of the RSI, CCI and OsMA oscillators. It helps you to identify potential upcoming reversals based on the values of the oscillator.
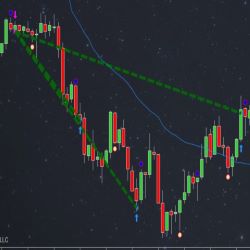
Easily build order flow strategies using bar point of control and value areas highs and lows. No complex coding required. Optimal Value Area is fully compatible with Strategy Builder.
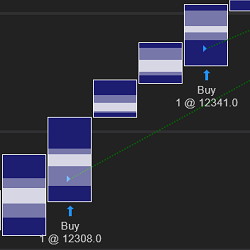
Automated Trading Strategy for trading MNQ.
With decades experience as an active trader & accredited coach, Mandi understands what it takes to build a successful trading career. She specializes in coaching HedgeFund, Prop, Bank & Private Traders around the globe in the essential mindset aspects of trading.
Gorilla Futures offers a complete FootPrint indicator. This indicator works on all NinjaTrader 8 licenses. FootPrint Pro™ is 100% customizable and can identify and alert traders to imbalances, delta signals, volume, and more.
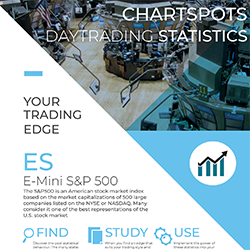
Use Statistics to determine intraday High Probability Targets and place stops outside of the regular market noise. This includes Stats on Initial Balance, Mid, Session & Extension ranges, as well as 1-minute rotations & many more! Available for ES, NQ, FDAX & FESX. Download your free report now!
tickmatrix is a small team of disciplined and dedicated programmers who architect intermarket trading strategies, indicators, API and more.
Empower your trades with precision. Set your daily support and resistance levels, and this bot executes and manages your trades, seamlessly. Trading made simple. Start your free trial today.
LizardTrader provides automated strategy programming and consulting services utilizing SharkIndicaors Bloodhound and BlackBird add-ons for Ninjatrader. Contact LizardTrader today for a quote or consulting sessions today!
December 2, 2024
Mastering Sideways Markets With Auction Bars and Range Projections
November 19, 2024
Enhancing Your Automated Trading System: Key Insights from Best Pro Trade
November 14, 2024
NinjaTrader New Ecosystem Tools: October 2024 Edition
Enter Email for Updates