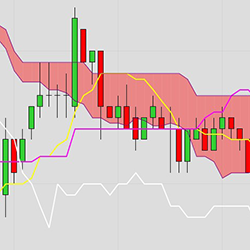
Free Ichimoku Cloud Indicator for NinjaTrader 8! This indicator can be used for both discretionary trading or as part of a NinjaScript based strategy. Download it today!
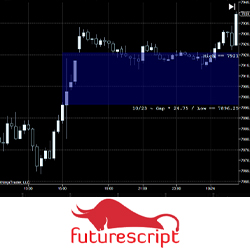
The Gap indicator was designed to illustrate when dramatic price disconnects from one period to the next when the market establishes critical levels. This indicator has been carefully constructed to explore different perspectives and trading approaches related to the gap in intuitive ways.
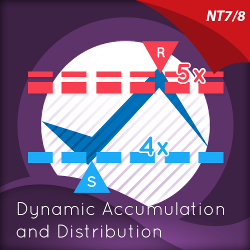
Dynamic Accumulation & Distribution plots graphically and numerically, how many times a price region has been tested. Levels tested more will appear as deeper lines, and levels tested less will appear as narrower lines, instantly revealing the depth of any accumulation or distribution region.
David Misselhorn is a software developer with over 30 years of development experience in trading clients, market data and order-execution software. He writes indicators and strategies for individuals wishing to automate their trading and analysis activities.
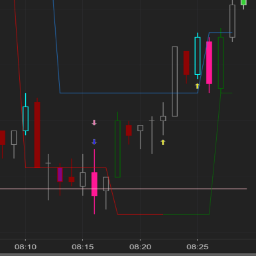
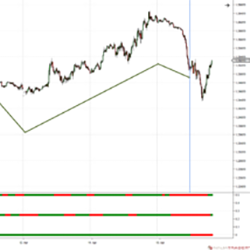
The EnlightCoders HeadScalper gives you market direction with a traffic light plot – red or green. SAT (Scalp Auto Trend) is a versatile and self-adapting tool to identify what is happening in the big picture. It reduces noise with smart filters and shows just one thing: the trend in red or green.
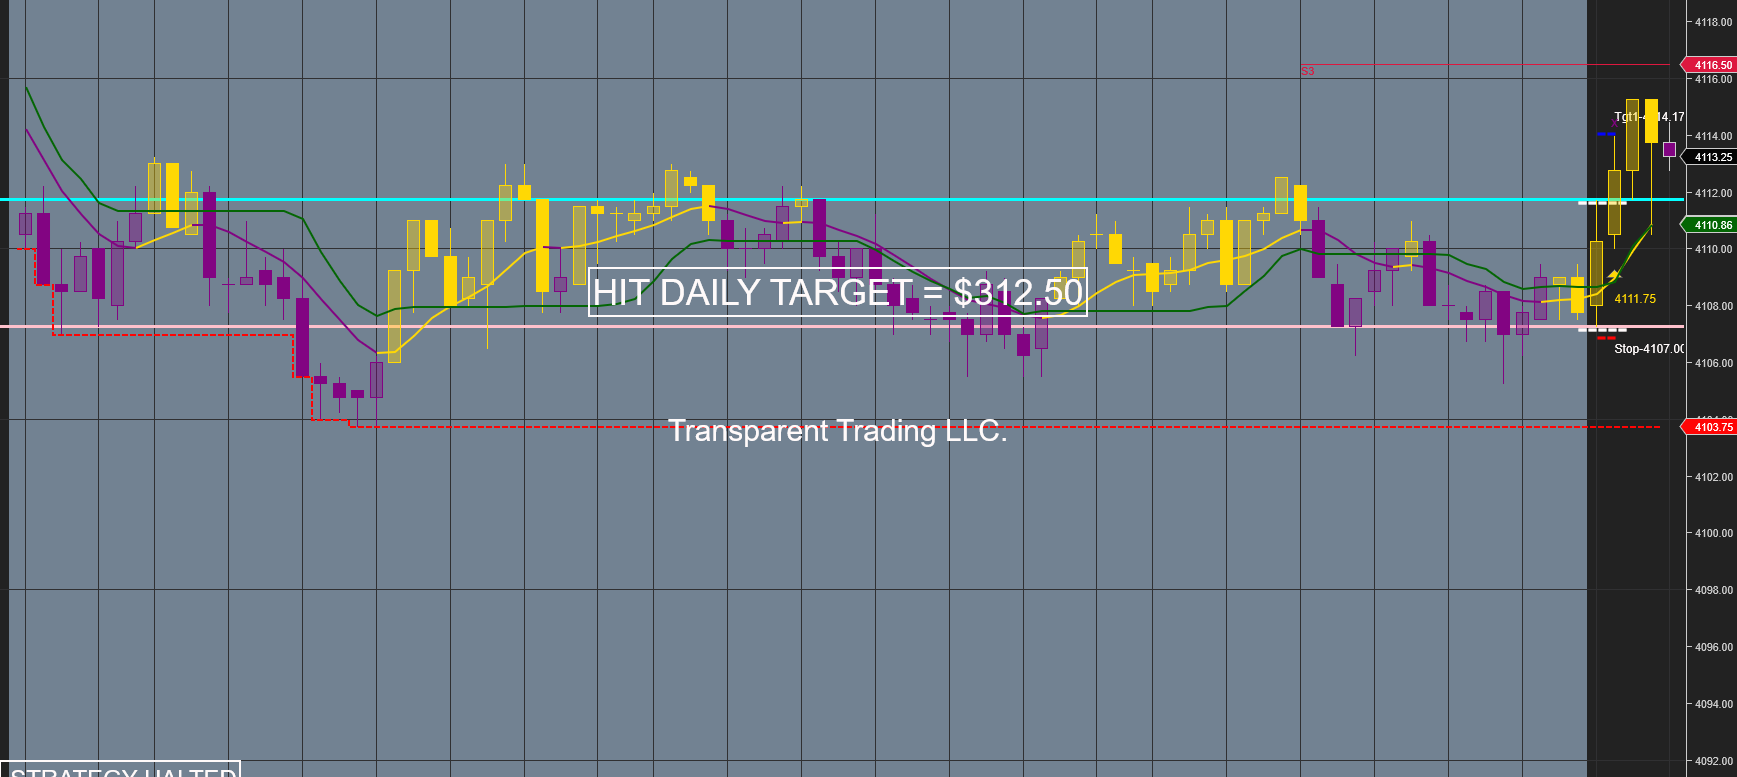
Our TTLLC Automatic OpenRange Style Day Trading System includes the ultimate breakout style for day trading. This style uses specific rules & coding that we’ve built into an automatic system. It's designed to define the trader specific points of support and resistance levels to trade from.
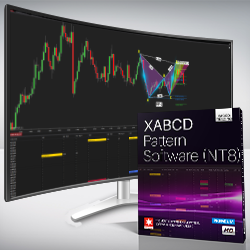
Saving you time is really import to us which is why the XABCD Pattern Suite will scan, find and alert you to XABCD patterns in any market and any timeframe. Once found, the pattern is automatically drawn onto the chart to make things easier. This includes everything you need to learn patterns.
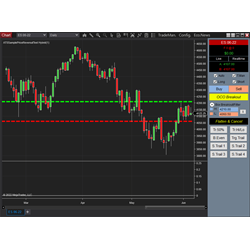
NinjaTrader 8 strategy unmanaged mode trade engine base foundation for futures, comprising of 4 bracket capacity, all in scale out - single entry position - multiple exits per trade operation, hybrid UI controls to allow semi/auto modes in trading the best of both worlds, open source with samples.
IATrend gives a clear indication of the trend of any financial instrument and does so on all different time frames.
This indicator alerts you to a possible turn around in price action. When combined with trend and indecision, it's a phenomenally simple and effective indicator. While no indicator is 100%, this is a great tool to have in your arsenal to get confluence and confidence when making trading decisions.
March 25, 2024
Trading Pullbacks and Reversals: Simplifying a Once Complex Retail Trading Strategy
March 21, 2024
VWAP Indicator: Average Price Shown Based on Price, Volume
March 18, 2024
Trade Copier Strategies: Make Efficiency Work for You When Futures Trading
Enter Email for Updates