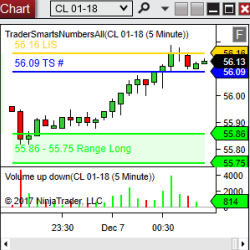
TS Trades is live market commentary, focused on identifying trade setups that are forming in real-time based on input from TS TradePlan. Get started with a 2-week trial for your favorite markets.
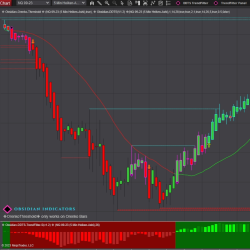
Maximize your trading prowess with the Dark Diamond Trend Sniper for NinjaTrader 8. Harness distinct buy/sell signals, real-time audio alerts and automatic support and resistance detection. Works with various bar types, including Orenko and Heikin Ashi. Try it free for 7 days.
The world’s first self-optimizing SuperTrend indicator. It uses spearhead third-generation scanning to identify actionable signals. Performance metrics like profit factor and number of winners are displayed on the chart to determine potential results.
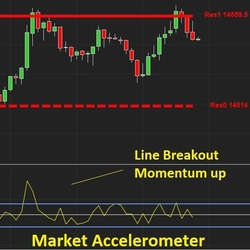
The E.G. AI Accelerometer reveals the driving force behind the price movements of an asset; by measuring how many buyers and sellers are in a market, it helps you form a view of the future direction of the price and – crucially – how fast that movement may be.
AITP Prop Trader is a unique automated trade management system. This automated trading software is designed to help prop traders manage money and control every aspect of their trades.
The Quantum Trend Monitor gives traders the confidence to follow trends, by incorporating an easy-to-read colored representation of current market trend. Use the Trend Monitor in tandem with other trend following analysis tools to help eliminate emotions from your trading!
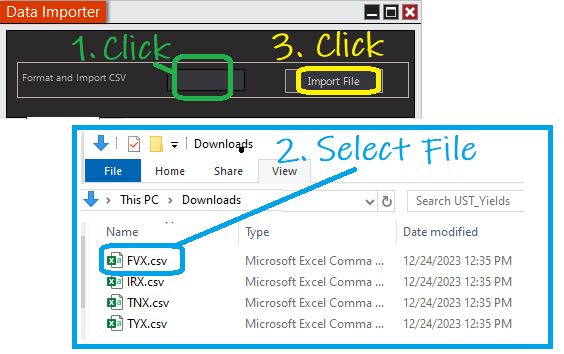
Quickly import any TXT or CSV data file into NinjaTrader for charting and analysis. Handles 450 different data formats. Historical price data, economic data and crop data can now be displayed inside NinjaTrader.
Sigmalab offers quantitative analysis-based technologies and services to analyze trading logics, operative patterns and trading systems. Learn more!
As a NinjaScript Consultant since 2008, Moore Tech, LLC has the experience to provide the solutions traders need. Whether traders are looking to have code converted from another platform, or bring their trading ideas to life, Moore Tech, LLC can help. Contact them today for a free project estimate!
Learn from a certified Mental Performance Coach and Veteran Trader! Discover how to control that voice inside of you that causes you to chase trades, enter too early, revenge trade, fear of missing out (FOMO), over trade, under trade, and blow accounts. And the list goes on...
March 25, 2024
Trading Pullbacks and Reversals: Simplifying a Once Complex Retail Trading Strategy
March 21, 2024
VWAP Indicator: Average Price Shown Based on Price, Volume
March 18, 2024
Trade Copier Strategies: Make Efficiency Work for You When Futures Trading
Enter Email for Updates
.png)