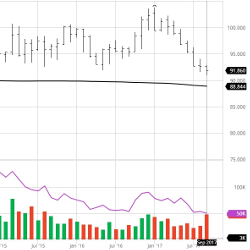
Chicagostock Trading’s Pro membership includes a live trading room with real-time charts to view trading signals on ES and CL Futures. Members also receive a daily technical analysis report by email before market open with proprietary volatility windows and pivots. Ask about a 2-week trial today!
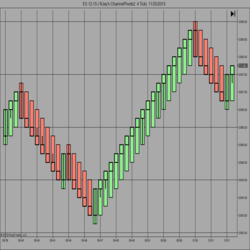
Pick from 8 different bar charts, offering features found nowhere else. Customized renko, range, tick, and time-based charts are available. Most charts have unique chart styles included (classic candle, price action, and xray). Get a free trial now!
Anchored VWAP: A dynamic tool for trading strategies. Coding friendly: One of the standout features of the Anchored VWAP is its coding friendliness. Users can seamlessly integrate it into the code of any NinjaTrader strategy, allowing for easy implementation and customization.
Collect MAE/MFE data where NinjaTrader leaves off. Get the ability to measure your moves after you're out of the trade.
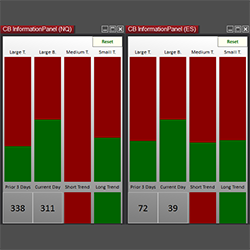
CB Information Panel gives you a snapshot of the buyers and sellers. Keep track of the prior day’s ranges and trend movement.
The HolyGrail Algo uses calculations of the Hull Exponential Moving Average to identify market direction. A long or short condition is printed on the chart showing the potential direction an instrument may move. HolyGrail mainly uses it for indices, but it works with any market and any timeframe.
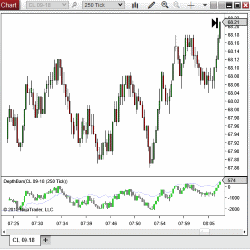
The Depth Bars & Pull-stack indicators by PureAlgo Capital detect changes in the total bid depth and total ask depth, providing a better idea of whether the bulls or bears are in control of the market & which players are about to fold.
The code you need to automate your trading. No more disappointing programmer deliverables or painstaking hours of DIY programming. We specialize in writing strategy code that removes the technical barrier to successful automated trading.
OTS Trading Strategies - Drawing from over 30 years of trading experience, OTS is delighted to offer exclusive insights into proprietary trading strategies.
This trading book is for the those traders struggling with psychology and entries with practical examples provided.
December 2, 2024
Mastering Sideways Markets With Auction Bars and Range Projections
November 19, 2024
Enhancing Your Automated Trading System: Key Insights from Best Pro Trade
November 14, 2024
NinjaTrader New Ecosystem Tools: October 2024 Edition
Enter Email for Updates