Emet Trading Solutions is a team of experienced programmers focused on coding custom automated trading strategies and indicators. The programmers at Emet Trading Solutions can turn trading ideas into fully automated systems and provide ongoing technical support. Get a free quote for your project!
Quality: ✅ Created by Johnny, a developer and trader for his own trading. ✅ More than ten powerful signals clearly codified and documented. ✅ Automatic creation of algorithmic zones. ✅ Use possible even without knowing the footprint. ✅ No risk of the graph freezing due to the tickreplay mode.
Fully automated E-mini trading systems. These auto traders are designed to operate continually and without any human intervention. All of our systems have gone through extensive testing to ensure that hypothetical backtests are as closely representative of a live trading environment as possible.
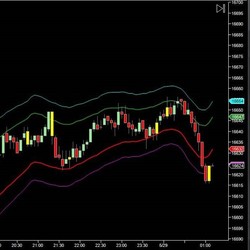
DTB Ultimate Bands is a next-generation of price envelopes that does all the heavy-lifting for traders. Once applied on a price chart, it pinpoints Overbought and Oversold areas with unmatched accuracy. Get a free trial!
Need a custom indicator, tool or strategy? Integrity-Traders offers a NinjaScript development service aimed at creating tools and indicators with a polished look and feel, precise operation and well documented parameters descriptions. Contact Integrity-Traders today!
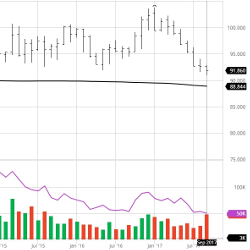
A precise analytical tool derived from statistical trading metrics such as prices and volume, offering insights to inform trading decisions.
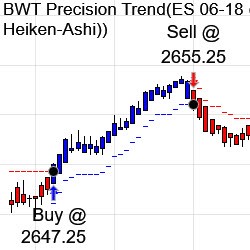
The BWT Precision Indicators originated in 2004. The BWT Precision Trend Indicator provides well placed potential trade signals and never misses a major move on your charts. Other BWT Indicators provide decision support using volume and price action.
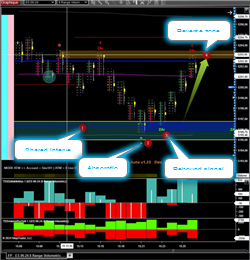
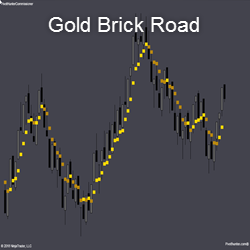
THE COMMISSIONER is only interested in the one single price of a bar/candlestick that has accumulated the most volume on close. This iteration is “The Gold Brick Road”. It gives a quick simple visual of consolidation and trend. When the bricks separate, a trend is predicted.
Chicagostock Trading’s Pro membership includes a live trading room with real-time charts to view trading signals on ES and CL Futures. Members also receive a daily technical analysis report by email before market open with proprietary volatility windows and pivots. Ask about a 2-week trial today!
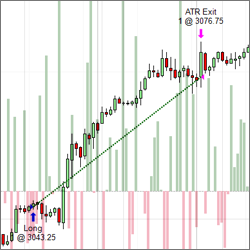
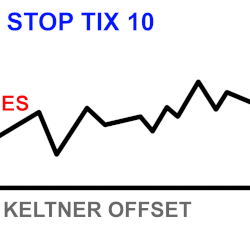
Stop Keltner uses Keltner Band distance to help give an estimated stop-loss in ticks, which is displayed in an easy-to-read text box on the chart. It’s also an excellent backtesting tool for getting estimated stops when identifying past trade entries on historical bars. Built for ES momentum traders
December 2, 2024
Mastering Sideways Markets With Auction Bars and Range Projections
November 19, 2024
Enhancing Your Automated Trading System: Key Insights from Best Pro Trade
November 14, 2024
NinjaTrader New Ecosystem Tools: October 2024 Edition
Enter Email for Updates