DataGrabber™ grabs price and volume data for any futures instrument. It is designed to work with the AI prediction software, AITrendPredictor™. DataGrabber™ data files get fed into AITrendPredictor™ to train the AI model to find patterns on price, volume, day and time to make a price prediction.
The SMA CrossOver Strategy is one of the simplest, for ease of use and understanding. This simple strategy has been amped-up to include current day price Highs and Lows, Traps, Consolidation, Long Bar and dynamic Bullish and Bearish trend algorithms for precision filtering to find the perfect entry.
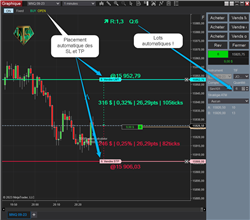
This indicator will automatically calculate for you the quantity of lots according to the position of StopLoss and the risk as a percentage of your capital. It will also place your StopLoss and TakeProfit. Finally get constant risk by trading on Futures contracts!
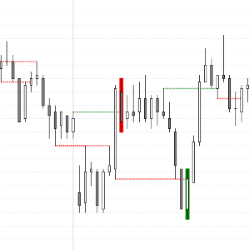
This indicator shows Breakout Tests or Breakout Pullbacks of broken support and resistance in real-time. As a beta feature you can also test Failed Breakouts. Use the Breakout Test indicator as a discretionary indicator in your day trading. Get started with a free 2-week trial today!
The indicator allows you to quickly open, close, submit, change, and cancel orders with ease. Its standout feature is the specially designed ladder columns, which provide a clear visualization of market behavior through detailed order flow information.
Pinnacle Quant offers custom, confidential NinjaScript programming and consulting services. Our services are offered for serious traders, CTAs, and hedge funds. Take advantage of our 20+ years of development and trading expertise. One-on-one consulting is available.
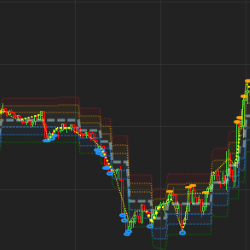
100% FREE - The TAS Market Map Indicator delivers the most visually appealing customizable market profile tool for traders. Its color-coded sideways histograms clearly reveal volume at price, value areas (red zones), master point of control lines (aqua lines), gaps and congestion.
This indicator tracks the Smart Money flow in the market. Following the Smart Money provides a better understanding of the volatility size and trend direction. Ready to see what the Smart Money is doing?
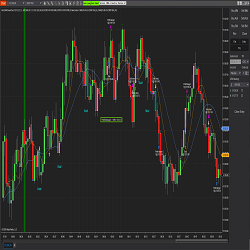
A cutting-edge indicator designed to make order flow trading both effective and enjoyable. Featuring an intuitive footprint chart, it provides valuable insights into historical and real-time market activity. The footprint chart reveals buy and sell volumes and order flow within each price bar.
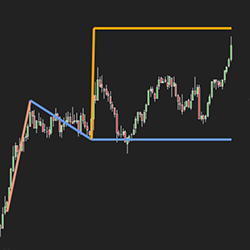
Measured moves are one of the most common trading strategies. However, they can be easy to miss. The Automated Measured Move Indicator from Tyche Trading takes away that difficulty, allowing you to focus on your trading. Never miss a measured move again. Get your seven-day free trial today!
December 2, 2024
Mastering Sideways Markets With Auction Bars and Range Projections
November 19, 2024
Enhancing Your Automated Trading System: Key Insights from Best Pro Trade
November 14, 2024
NinjaTrader New Ecosystem Tools: October 2024 Edition
Enter Email for Updates