The Pyramid Bundle is a great value and contains our entire collection of current and future indicators. As an owner, you'll never pay more for premium support, upgrades or new product releases. Receive instant access to our entire collection of indicators with a free 14-day trial!
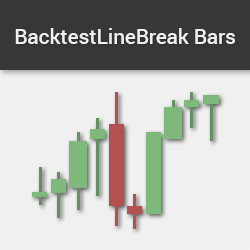
The Line Break Bar is one of the most effective ways to reduce chart noise. It provides accurate back-testing results by showing the correct open prices and restoring the wicks. Easily recognize divergence & price action patterns & eliminate noise from traditional minute charts. Get started today!
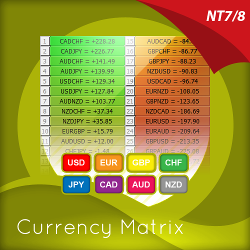
The currency matrix indicator is a simple solution to a complex problem, revealing sentiment for the currency across the currency complex. Now traders can know when they're trading with the universal flow, not against it. Learn more about this unique Forex indicator for NinjaTrader!
Volume Profile Composite features 7 configurable Profile Durations (including Daily, Weekly, Monthly, Contract, User Defined), 8 Levels of Significance (VPOC, VA’s, VWAP, High/Low/Mid, PClose), 3 Modes of Calculation (bar/min/tick), a profile summary, and simple configuration thru the toolbar icon!
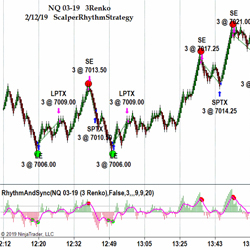
When the ScalperNinja and the Rhythm Indicator generate a signal and both are in sync for a predefined number of bars, the RhythmStrategy enters an order. Both work independent of each other and the Rhythm Indicator can also be used on its own for manual trading.
StockAlgo is a cutting-edge trading signal app tailored for NYSE stock traders, delivering accurate signals for NYSE stocks. Benefit from a 3-day free trial to test its reliability. Available on both iOS and Android, StockAlgo equips traders with timely insights to make informed decisions.
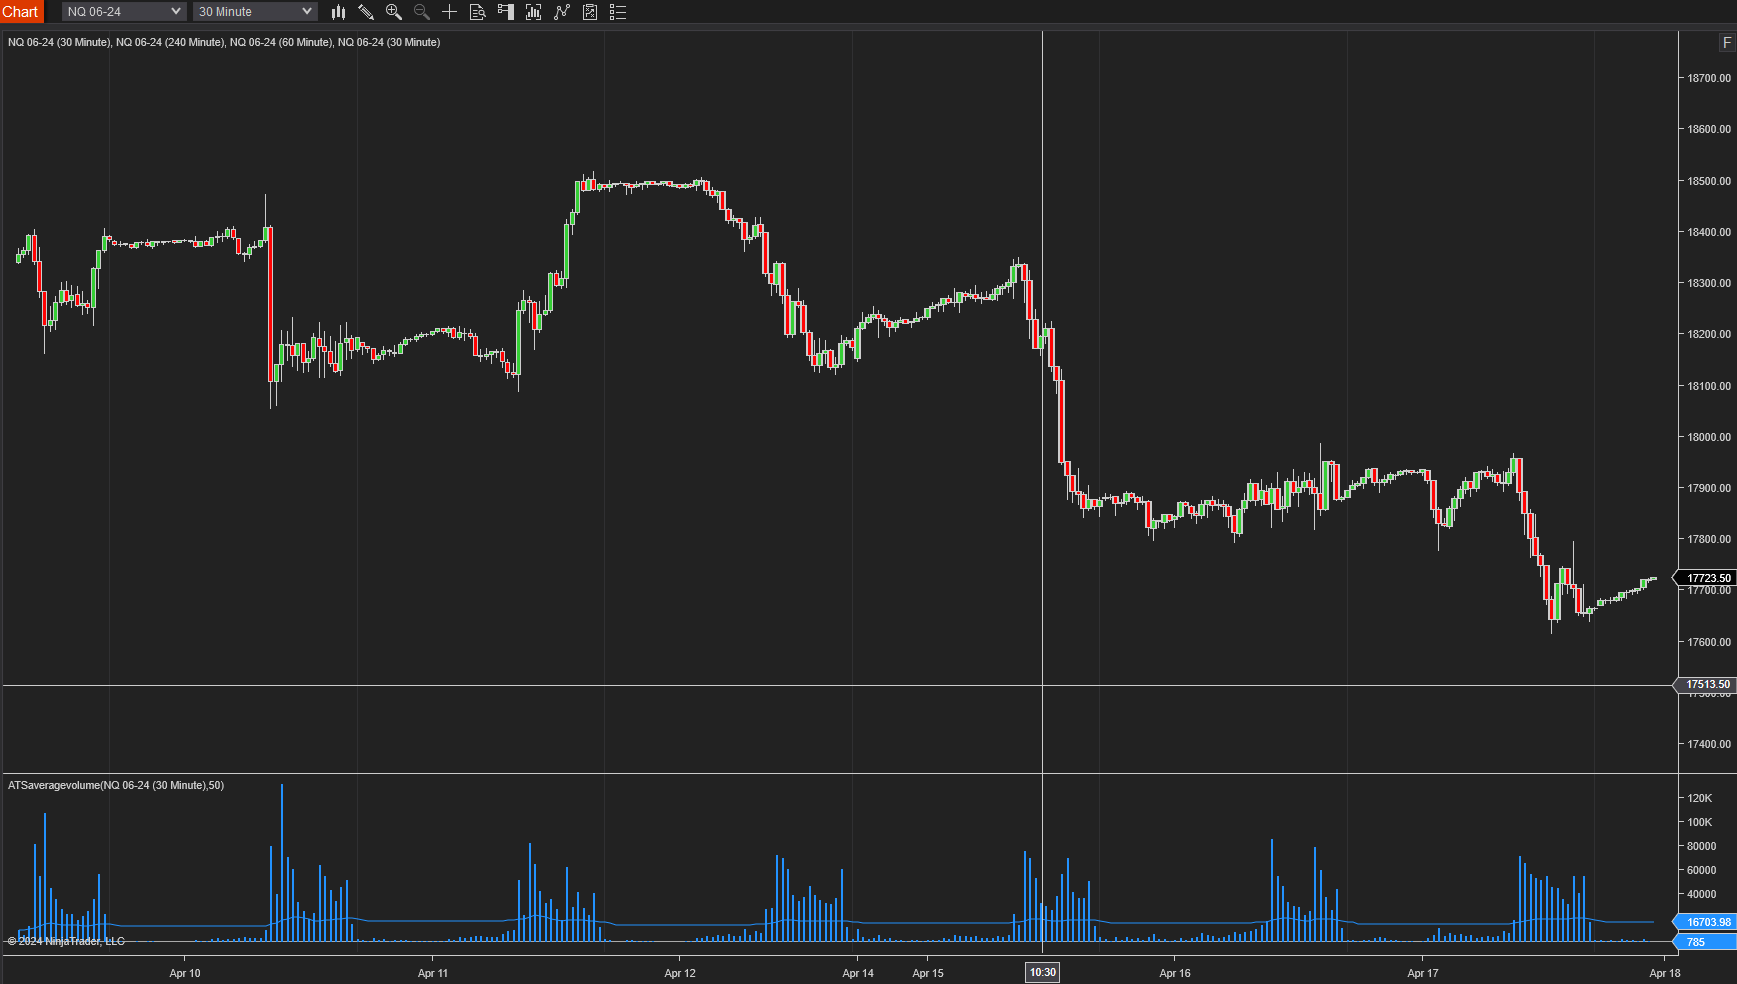
This indicator plots a 50-bar average of the volume overlaid on the current volume. You can change the number of bars used to calculate the average.
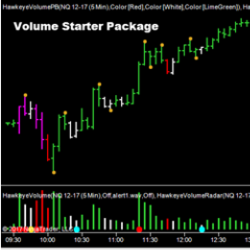
Hawkeye Starter Package is an immensely powerful leading indicator that performs over 300 calculations per bar to analyze the price action and associated volume, signaling price movement prior to it happening. Buy the Hawkeye Starter Package now at its affordable low price!
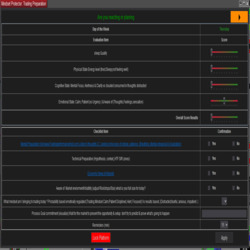
Fully customizable platform-integrated Trading Performance Toolkit that includes daily session preparation and mindset window, trade evaluation window, trader break reminder window, journal, emotional pattern and habit tracker, daily score card and performance stats window, account risk management.
ICT's Fair Value Gap indicator retains a configurable number of gaps, and there's a setting to remove those that have been crossed by price. The style of the rectangle and the rays from the gaps are customizable by creating a template for a rectangle named "FVG Up Gap" (for the Up gaps).
December 2, 2024
Mastering Sideways Markets With Auction Bars and Range Projections
November 19, 2024
Enhancing Your Automated Trading System: Key Insights from Best Pro Trade
November 14, 2024
NinjaTrader New Ecosystem Tools: October 2024 Edition
Enter Email for Updates