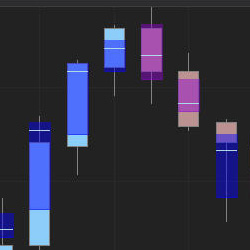
Highlight the Value Area (VA) & Point of Control (POC) of every single candle on your chart, or filter candles with high volume only. The Value Area is colored by the Bid/Ask delta. Get started with a free 7-day trial today!
Patented! 'UFOs' stands for UnFilled Orders. Intelligent technology saves time and adds precision when planning entries and exits. Identify buy and sell UnFilled Orders in all markets and timeframes. Answers the question, “What is potentially an intelligent buying price or selling price?”
With a potential of 1 trade per day, this system is automated from start to finish & designed to be monitored in some capacity. If you can remotely access a computer with the right software, then you can monitor these automated trades from the golf course (with a strong cell signal).
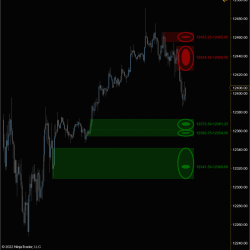
Ultimate Support and Resistance Suite provides precise support and resistance lines and zones to trade any market on any time-frame. This tool enables you to accurately determine which supply and demand price levels require your attention. Use it as a standalone indicator or enhance any system.
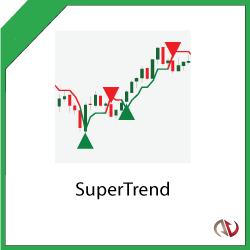
Our SuperTrend Indicator will catch the trend and improve trading consistency with smart trend-following trading signals. SuperTrend highlights trend direction, continuation and reversals while filtering out false signals. Buy & sell signals are printed onto the chart when trend direction changes.
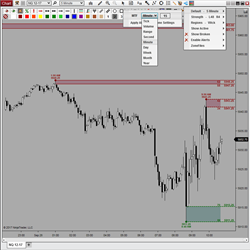
Supply & Demand MTF automatically displays areas of support and resistance. It features 8 unique Zone Types with abilities to show, hide, add, remove, modify, merge, save or load templates with a single click via a unique right click context menu or toolbar icon. Strategy Builder & Bloodhound Ready!
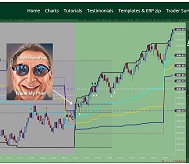
A powerful self-study program that will help you learn the core principles and implementation of the Hunt Volatility Funnel Method with a total of 18 hours of material, topic by topic, alongside case studies and live trading webinars.
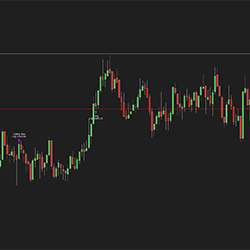
Free Discord EdsRetracePlan with Markers Plus CHAT. Using a single indicator and Range charts, you can automate CL, NQ and GC trade entries by turning on Markers Plus. Trades will be taken using the ERP long or short signals. Talk in the free Discord chat about how easy it is to trade with ERP & MP.
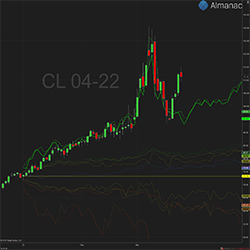
Accrue Inc. didn’t invent seasonality – they just made it easier to see and trade! Almanac™ Calendar Analytics creates better awareness of seasonality with 90-day price projections across five different market scenarios.
Bold Bot is a strategy for NQ which will analyze the product for long trades.
March 25, 2024
Trading Pullbacks and Reversals: Simplifying a Once Complex Retail Trading Strategy
March 21, 2024
VWAP Indicator: Average Price Shown Based on Price, Volume
March 18, 2024
Trade Copier Strategies: Make Efficiency Work for You When Futures Trading
Enter Email for Updates