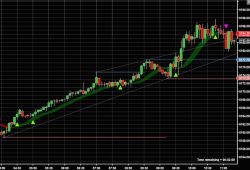
The TrendLord indicator is a chart overlay indicator that can be used as a confirmation indicator. It is a derivative of a smoothed moving average but with the advantage of representing it as a colored change histogram. Click to learn more.
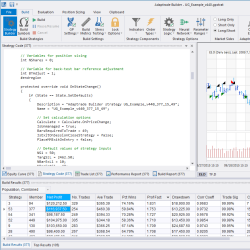
Developing automated trading strategies can be time consuming and difficult. Adaptrade Builder is an advanced trading strategy generator that will quickly find, code and test unique and complete trading strategies based on your requirements. Start building strategies today with a free 30-day trial!
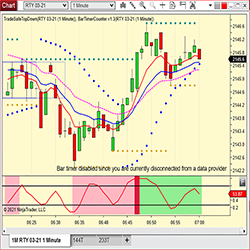
This free package includes Symbol Watermark, which shows the name of the symbol and time frame directly on the chart; Trader Limit, which limits trading when the daily loss level is reached; SR Dynamic Lines (dynamic resistance zones); and many other useful tools. These products are free for life.
Trend Support & Resistance works great as a companion to the Trend Ribbon & Buy/Sell indicators. This indicator identifies support & resistance levels plus forecasts highs / lows. Helps you predict upcoming reversals with confidence. Adjust to your style of trading: intra-day, swing or longer.
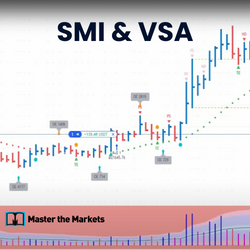
SMI was developed by the quants in the 1960's to help quantify tops and bottoms. It gives 3 strategy stats based on probabilities. However, a small limitation of the SMI is in selecting the T&Bs that are going to run. VSA helps you overcome that by looking at the volume for a big move.
This basic indicator is simple but very powerful. It provides an entry, stop and trailing stop. Knowing when and how to employ this indicator is taught in the trading room.
Speeding Trading Servers offers high performance co-located virtual & dedicated servers (VPS) for professional & retail traders. Optimize fills, reduce slippage & run automated trading strategies 24/7 from any location. Sign up for a free one week trial today!
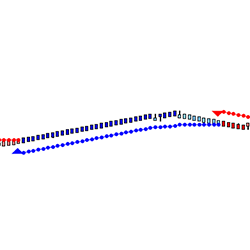
Nova Wynd RK is a renko-optimized version of the Nova Wynd indicator. We eliminate the High & Low prices and only focus on the Close price in the calculation of the reference price. ninZaATR is also replaced by Tick as the unit of offset.
TradeSafe is a Boolean-logic, rules-based mechanical day trading system that automatically determines strength of trend and optimum exit strategy and plays audible spoken alerts. Nearly 100% automated, it uses benchmarking for consistency. Watch replay: https://daytradesafe.com/replay/
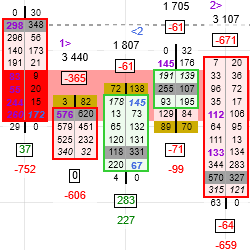
GomOrderflowPro displays the following data: sells, buys, delta & the associated calculations. It computes buy/sell imbalances & builds the associated support and resistance zones. The plots are available for building strategies or populating the Market Analyzer window. Free 2-week trial available.
December 2, 2024
Mastering Sideways Markets With Auction Bars and Range Projections
November 19, 2024
Enhancing Your Automated Trading System: Key Insights from Best Pro Trade
November 14, 2024
NinjaTrader New Ecosystem Tools: October 2024 Edition
Enter Email for Updates