The Smart Momentum NinjaTrader Indicator tool has a unique design compared to other momentum indicators. It uses an averaging mechanism that analyzes the cycle and adapts to it. This results in a momentum plot that is simultaneously smooth and sensitive.
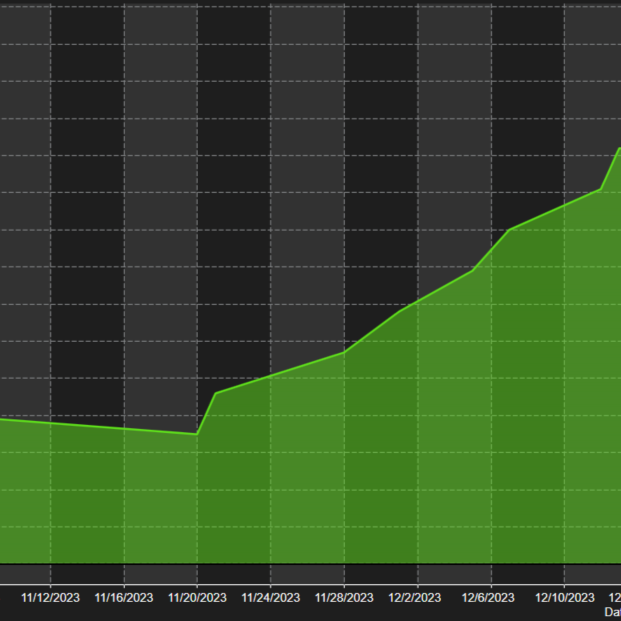
Our automated trading system features scalping, swing trading, automatic entry & exit signals and price action-based trading. With no optimization required, the Best Pro trade systems are based on statistical analysis and algorithms based on advanced mathematical computations.
Quintalytics develops custom trading software for retail and institutional traders, brokers and other industry professionals for both NinjaTrader 7 and NinjaTrader 8. We have utilized and developed hundreds of custom indicators and trading strategies over 20 years. We can also modify and optimize.
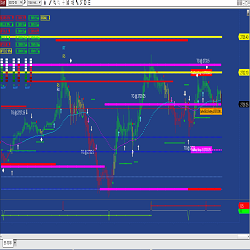
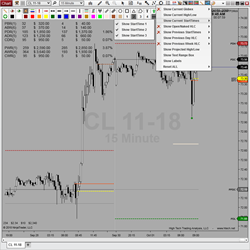
Price Times Plus plots 24 current, previous & projected OHLCR levels of significance! It features both daily & weekly levels, projected ranges, 3 user defined start times, unique summary information, a toolbar icon for easy configuration, and is Market Analyzer, Strategy Builder & Bloodhound ready!
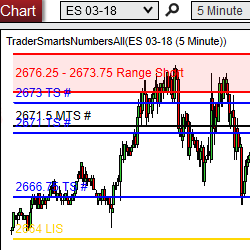
TS TradePlan is a precise support and resistance based trading plan, available for ES, YM, NQ, 6E, CL, and GC futures markets. Trade Plans are produced daily. Get started with a 2-week trial today.
This automated trading strategy is designed for the Russell 2000 futures market. The strategy is easy to use, making it suitable for both experienced traders and beginners. Find out more on www.russell2000strategy.com.
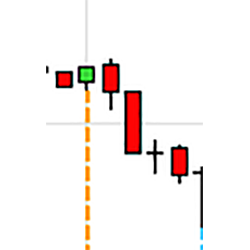
Several studies have found a connection between full and new moons and stock market performance. Knowing how and when to time the cycles in trend shifts is centuries old, but new to most traders.
Trail a stop automatically behind a wide range of indicators: Price Action, ATR, Bollinger Band, Swing, Parabolic SAR, Donchian Channel, or 9 different Moving Averages. Trailing Stop Expert works on Futures, Forex or Stocks. Grab a 7-day free trial now!
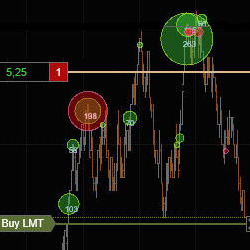
Would you like to see traders' emotions visualized right on a chart? Identify developing intraday reversals in real time, detect where retail traders place their stops and trade against them. Check historical data for solid setups. Get started with your 7-day free trial today!
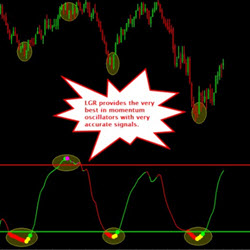
The LGR is a composite Triple Momentum Index Oscillator. LGR indicator is a proprietary design that gives the trader the crème de la crème of momentum oscillators by combining into a single indicator. No more figuring out which oscillator to choose.
December 2, 2024
Mastering Sideways Markets With Auction Bars and Range Projections
November 19, 2024
Enhancing Your Automated Trading System: Key Insights from Best Pro Trade
November 14, 2024
NinjaTrader New Ecosystem Tools: October 2024 Edition
Enter Email for Updates