Alerts on two-legged pullback status. Fourteen price action signals: second entries, higher low, lower high, failed 2E, etc. Five filters and preferences: reset on double top, engulfing bars, risk limit, etc. Precise counting of second entry, Mack’s technique. Flexible setup. Start a free trial now.
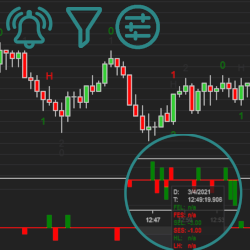
Simplify your trading & save monitor real-estate with the TradeFinder Market Analyzer Add-On. This tool drills-down to dissect & monitor multiple markets, timeframes & instruments to spot trends, momentum & price action in real time, complete with pop-up, email & audible alerts! Learn how!
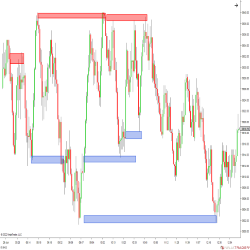
The V-Zones Trading Course is a fresh and unique approach to trading supply and demand and value. The dynamic approach to analysis gives you a trading map with precise trade locations and the skills to spot potential turning point locations in the markets.
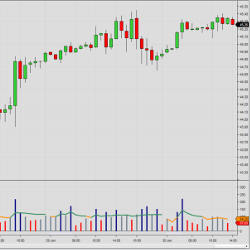
The Relative Volume indicator identifies high/low volume bars by comparing current volume against the average volume over the same period during the preceding days/weeks.
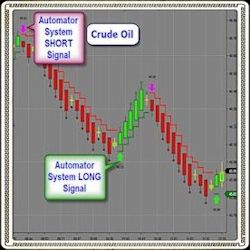
Automate your trade setups in real time with The Trade Automator! Backed by powerful built-in algorithms, the Trade Automator can help you become a more consistent trader, improve the timing of your entries & minimize emotional trading. Come see for yourself!
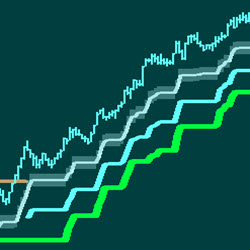
The ATR Stop is a simple but powerful tool to help the trader stay in a position longer and with greater confidence. Employs a proprietary “filter” to eliminate “false positives.” PTG ATR Stop Indicator is your confidence builder. Ask about PTG's Auto-Trade Assistant (ATA) Strategy.
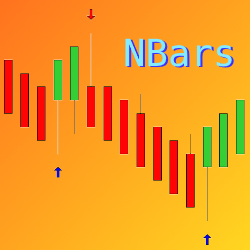
The TIS_NBars_UpDown indicator paints signals of the "OpenClose Setup" on the chart. It detects bar color changes and includes multiple filters for fine-tuning. See a video demonstration of the Nbars indicator in action.
ChartVPS provides high-end virtual private servers (VPS) to traders, enabling them to automate strategies & securely trade from any device, anywhere 24/7. Our servers & network are built specifically for trading & NT platform, ensuring compatibility, ultra-low latency & smooth operation.
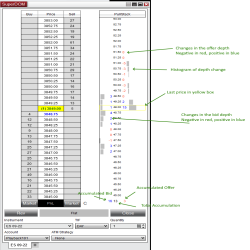
The Pull Stack Super DOM column shows you changes in the order book. There are several modes to this indicator to help give you a nuanced view and find the state of the market at each price level.
PriceActionPivoter is a fully automated trading system that uses price action and pivot points to execute trades. Primarily designed for ES/MES, but you can trade anything on it. This trading system also offers money management settings so you can have full control over every aspect of your trading.
December 2, 2024
Mastering Sideways Markets With Auction Bars and Range Projections
November 19, 2024
Enhancing Your Automated Trading System: Key Insights from Best Pro Trade
November 14, 2024
NinjaTrader New Ecosystem Tools: October 2024 Edition
Enter Email for Updates