The SRM App is an automated risk-management solution that solves 16 common trading problems; overtrading, over-leveraging & emotional decision-making. Prevent costly errors by solving problems in real-time.
Tradesyncer is a powerful trading solution that synchronizes all your futures (prop firm) trading accounts across multiple brokers, platforms, and data feeds. This dashboard lets you monitor and manage your trade data, ensuring efficiency and insights from one centralized location.
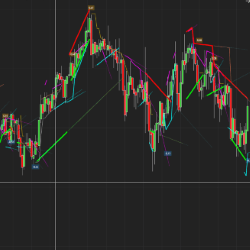
Trendlines can be drawn in so many incorrect ways. Drawing it incorrectly can make most trades losers and vice versa. Getting it right makes all the difference! QTL has a faster and far more accurate approach. Ready to automatically find the most accurate trendlines?
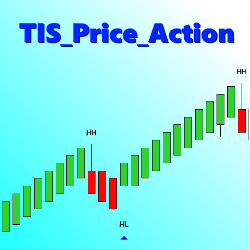
The TIS_Price_Action indicator detects and ranks pivots, then looks for a user specified sequence, such as Highest Low followed by Highest High to paint a long signal. Users can trigger 1 to 3 pivots to trigger a signal.
12tradepro.com provides advanced, highly predictive, and reasonably priced software for trading global financial instruments in multiple time frames. Our technologies incorporate rule-based discretionary, semi-automated and fully automated approaches.
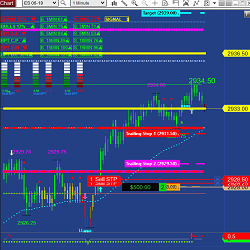
Would you like to access planning charts from the top retail traders in the industry which could help you become a more consistent trader regardless of whether the market is trading up, down or sideways?
The Oil Trading Room is a product of Robbins World Cup Champion Trader Rob Mitchell. It has a unique Scientific approach with Trading Signals, Indicator applications using Market Profile, Price Action, Order Flow, Momentum, Order Flow Momentum, Support Resistance, Market Mapping and more.
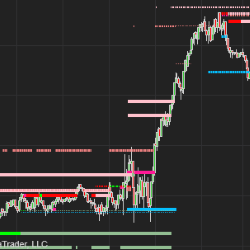
QSR Pro utilizes their advanced techniques to identify, validate, and invalidate support and resistance levels like never before. Unlike other indicators that rely solely on swing highs and lows, QSR Pro incorporates multiple factors to ensure precise support and resistance identification.
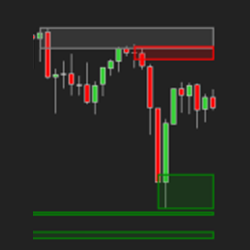
Q-PZone provides visual naked volume point of control (VPOC) zones. These VPOC zone levels are significant because they can act as a support or resistance level.
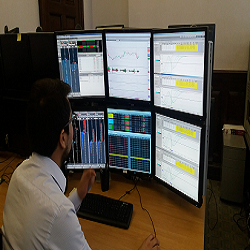
This is an intensive one-week course that by the end of the week will have you making confident trading decisions on various asset classes. If you have an inner trader we will find it. This course also includes a free trading challenge to qualify for a funded trading account.
December 2, 2024
Mastering Sideways Markets With Auction Bars and Range Projections
November 19, 2024
Enhancing Your Automated Trading System: Key Insights from Best Pro Trade
November 14, 2024
NinjaTrader New Ecosystem Tools: October 2024 Edition
Enter Email for Updates