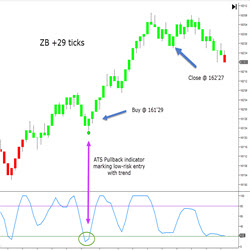
The TrendContinuation indicator identifies and alerts the trader of high probability continuation trades in the direction of the major trend. Using a time tested algorithm for determining possible low risk entries, this indicator marks the location and can notify the trader via email or text.
Discover top trading opportunities for US stocks, Wyckoff method analysis in US indices futures, Gold, Silver, market internals, and more to look for “time sensitive development” trading opportunities. Discuss your trading plans and past trade reviews to sharpen your price action trading skills.
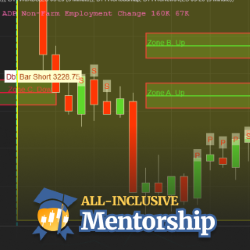
Day Trading Course with Order Flow analysis and live trading sessions.
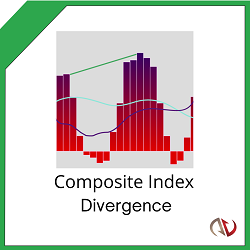
See trend reversals before they happen with intelligent divergence signals! Predict the trend ahead of the crowd with precise entry and exit points. This innovative indicator uses momentum calculations to warn of trend reversals before they happen!
Trading OrderFlow provides expert service in converting NinjaTrader 7 scripts to NinjaTrader 8. Enhance your NinjaTrader add-ons with NinjaTrader 8's multi-threading capabilities. Contact them to learn how they can convert your add-ons to the latest version of NinjaTrader!
Upgrade to the silver plan for enhanced trading capabilities. Get all the features of the bronze plan plus the reference synchronizer module. The reference synchronizer indicator ensures seamless data flow between different charts, including market profile, daily, weekly and monthly charts.
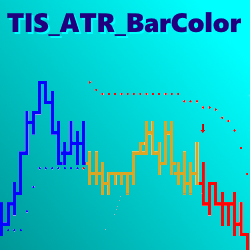
The ATR_BarColor Setup is the evolution of Supertrend; it adds a 3rd state ( Trending Up, Trending Down and Non-Trending ) that helps to avoid sideways market conditions. Bars are colored for quick condition identification.
This masterclass delivers on all fronts, providing all the fundamental knowledge and practical trading skills required to trade any asset class and in any market conditions. This course is designed specifical for those committed to making trading their career. Diploma plus gain your trading skills.
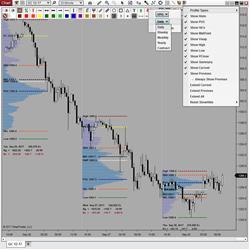
Volume Profile Sessions features 5 Profile Durations (Daily, Weekly, Monthly, Yearly, Contract) and 3 Modes of Calculation (bar/min/tick). It displays 8 Levels of Significance (VPOC, VA's, VWAP, High/Low/Mid, PClose) & session summaries, and provides simple configuration thru a toolbar icon!
Become a pro trader via an eight-week trading school. All courses & software are included. Receive live training from a coach who teaches you over 10 price action methods & how they work together to form a complete plan for daily trading. Learn the exclusive Roadmap & Blueprint techniques.
December 2, 2024
Mastering Sideways Markets With Auction Bars and Range Projections
November 19, 2024
Enhancing Your Automated Trading System: Key Insights from Best Pro Trade
November 14, 2024
NinjaTrader New Ecosystem Tools: October 2024 Edition
Enter Email for Updates