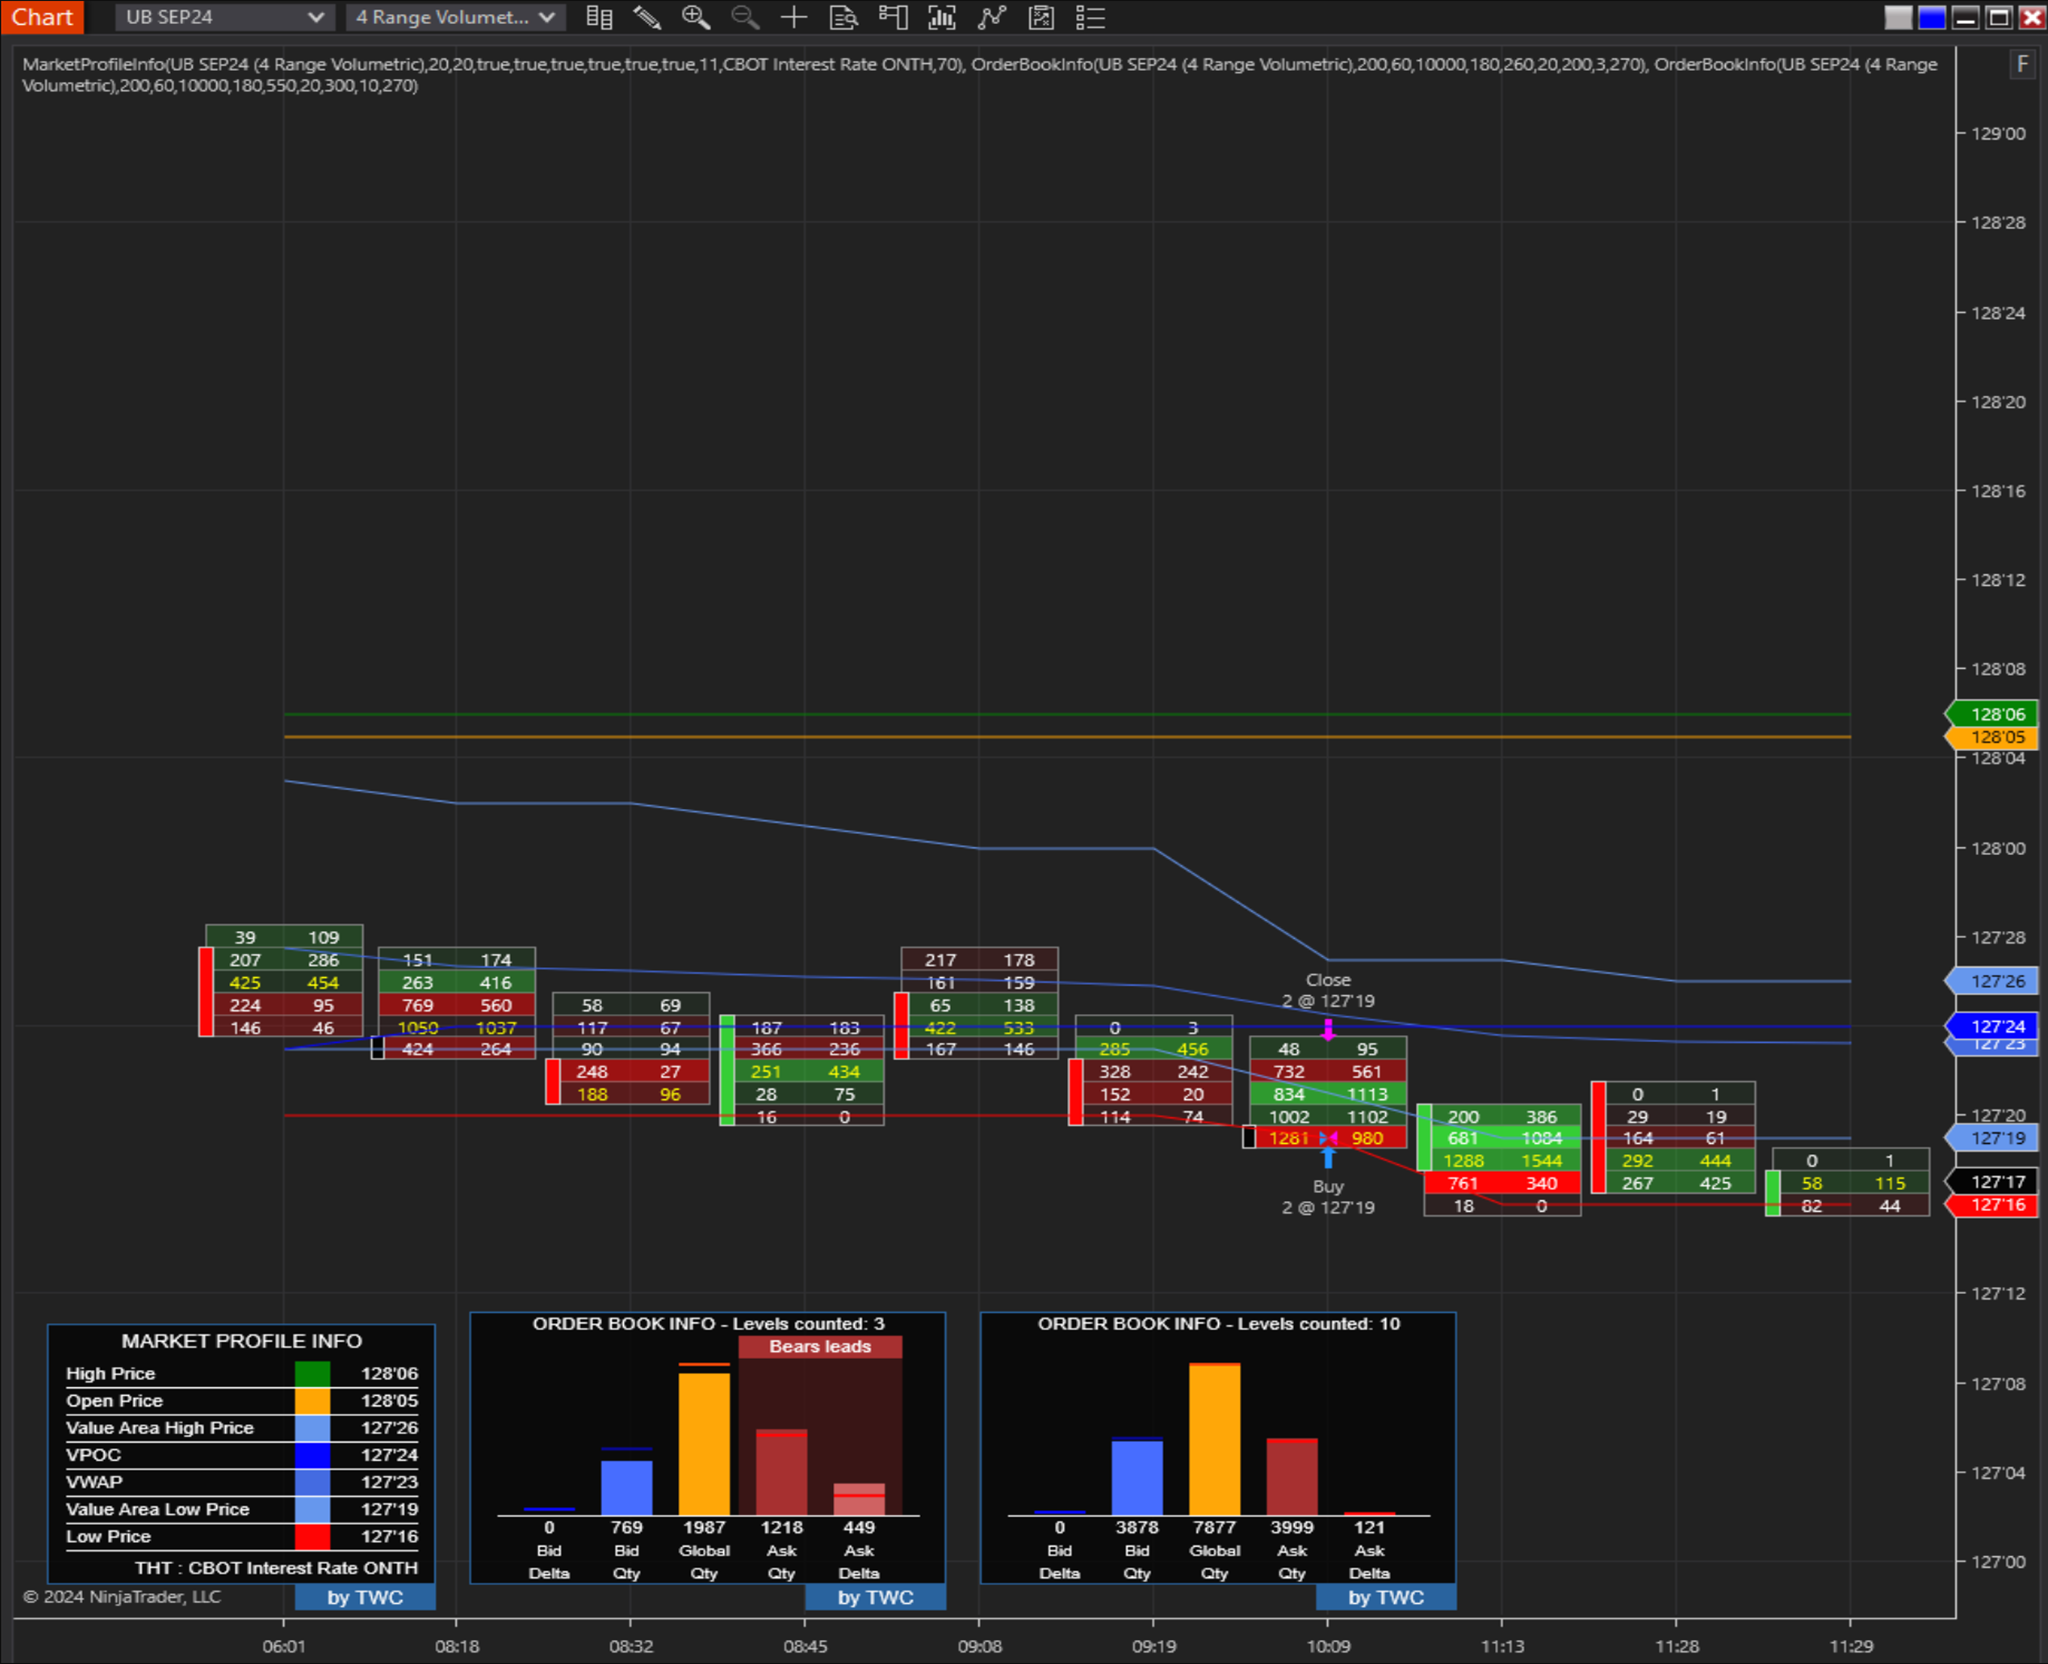
The power of TWC Market Profile Info and TWC Order Book Info. Traders gain a clear understanding of market dynamics. The Market Profile tool provides critical insights into key market points and trends, while the Order Book tool offers real-time visualization of order flow dynamics.
This trading indicator is the ultimate “go/no-go gauge” for any trading strategy. A sub-chart that looks up six timeframes and gives real-time BIAS. Bullish, neutral or bearish on each level. Making decisions and acting on trading signals made easier!
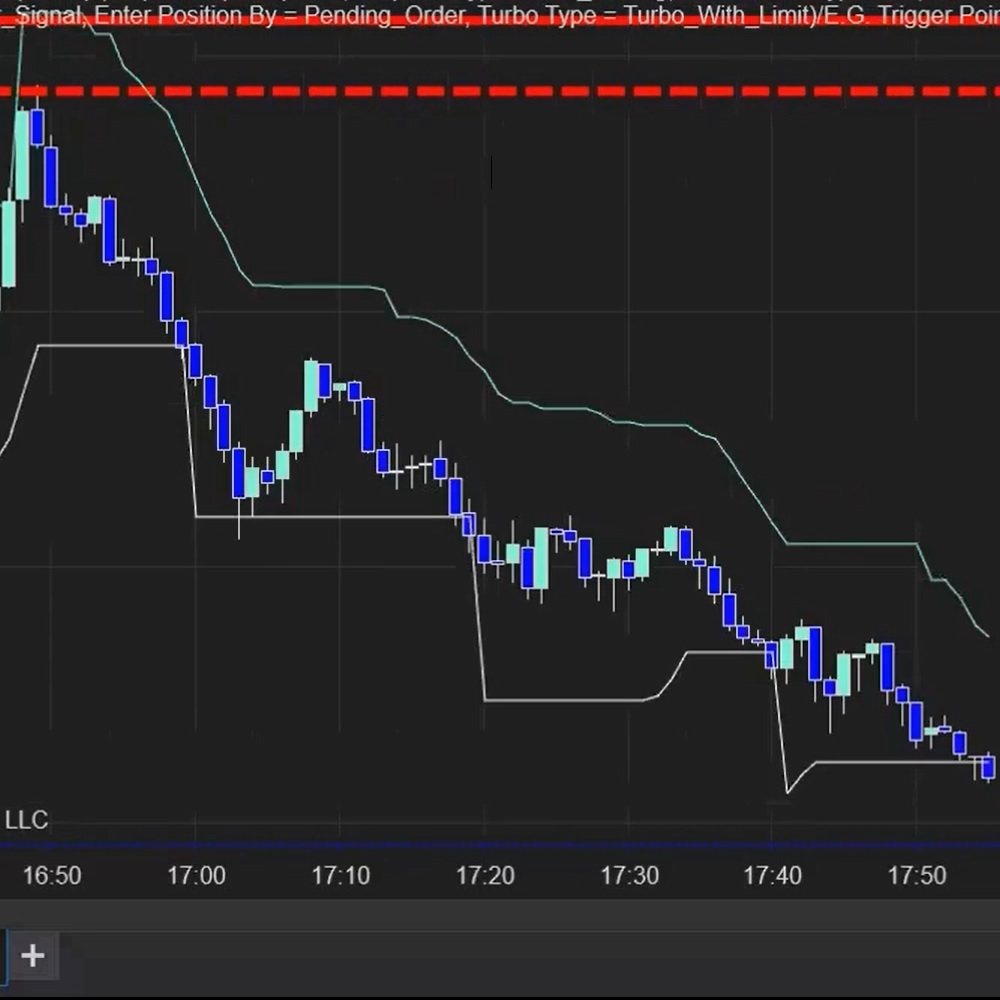
The E.G. Trailing Stop draws the trailing path for you. It considers the asset’s volatility; based on the Average True Range (ATR), it estimates the next price level to optimize your profit targets.
HelloWin Backtest is a revolutionary trading analysis tool offering an intuitive PnL graph for real-time system evaluation. Supporting various bar types, slippage adjustments, and a unique two-round logic for defining entries, it mirrors the strategic approach of professional traders.
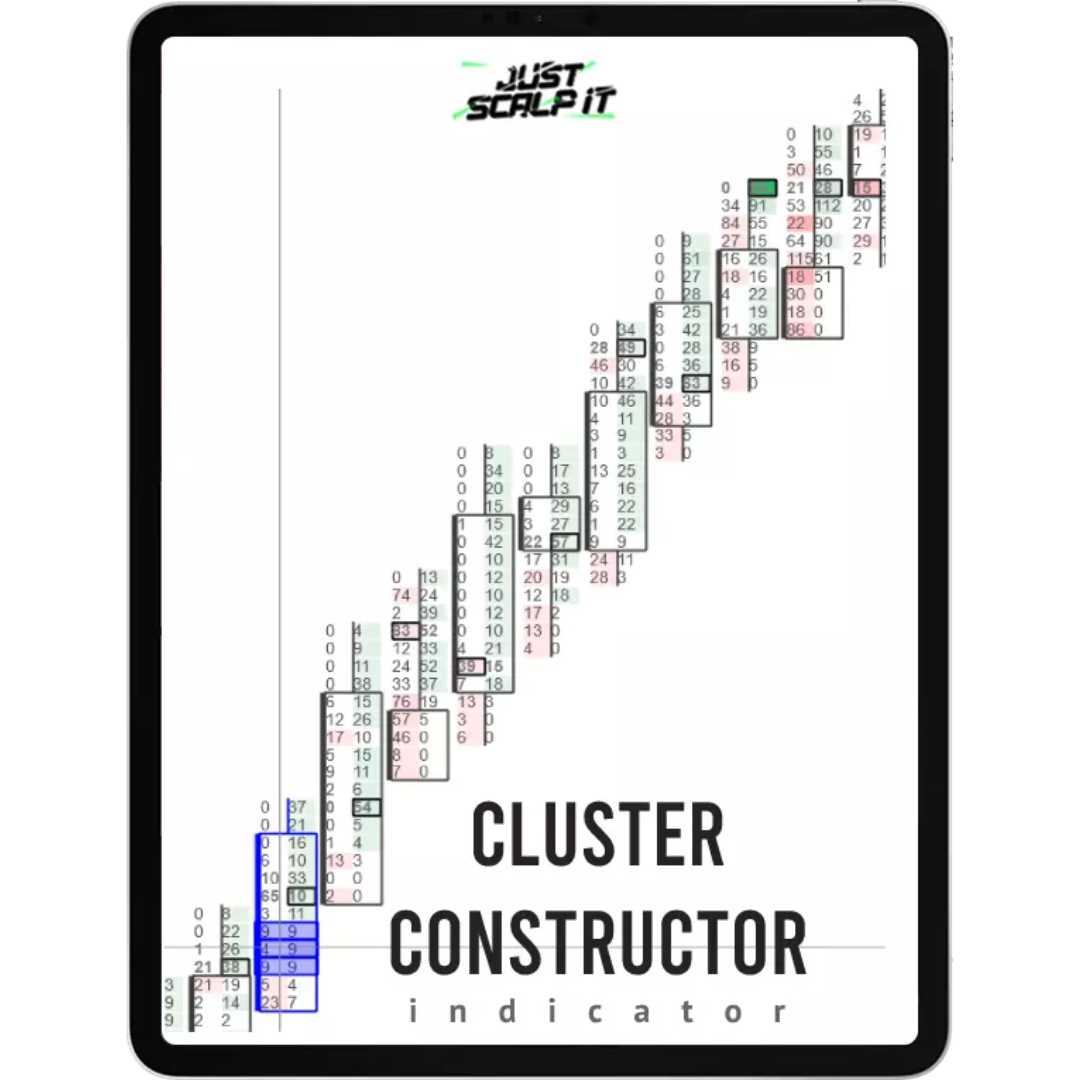
Explore the advanced order flow indicator, Cluster Constructor, featuring 16+ filters for deep market analysis (footprint charts). Ideal for unveiling smart money and institutional trends, enhancing order flow trading strategies. Delve into sophisticated insights – start now!
Find out how you can identify accumulation and distribution with price action trading. Spot the footprints left by “smart money” with price and volume, the Wyckoff method way, when day trading or swing trading the stocks and futures. Join today and be part of the lifetime community group.
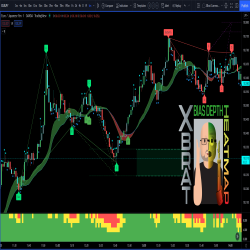
Our trend indicator was designed to offer an easier way to look at candlesticks on a trading chart. It uses a Heiken Ashi formula to improve the visualization of trends & aims to help spot trading opportunities more easily. Its visual approach provides a better picture of the trend. Get it today.
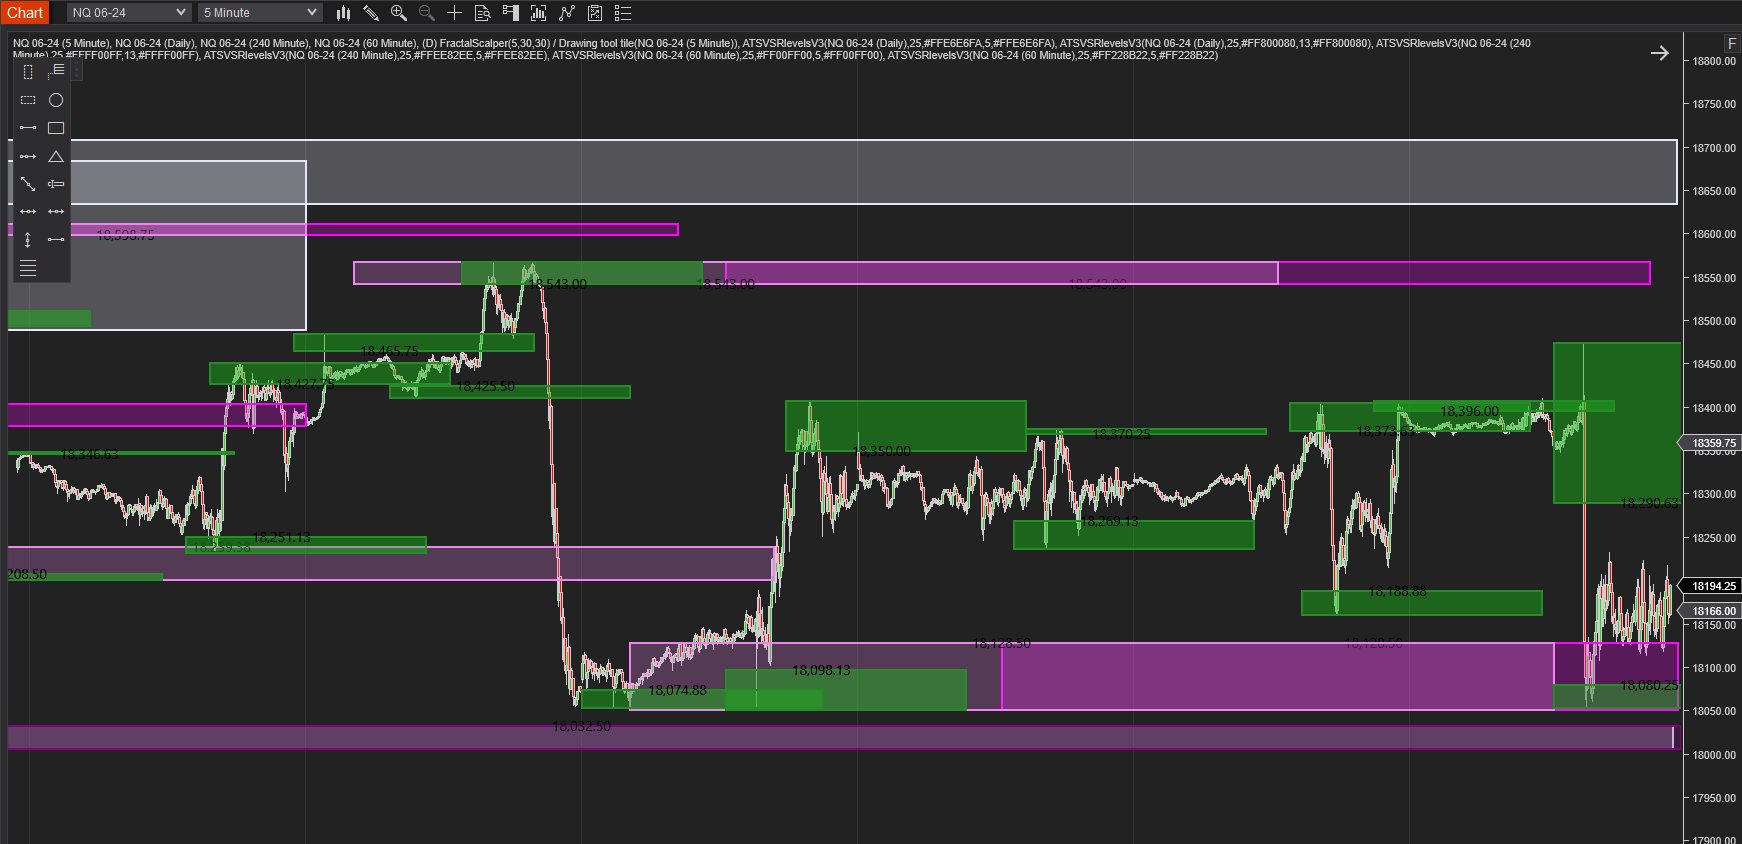
This indicator is designed to provide the trader with better trade locations by plotting visual support and resistance levels at swing points in the market. When multiple data series are used, the ATS VSR Levels can be plotted using the higher timeframe.
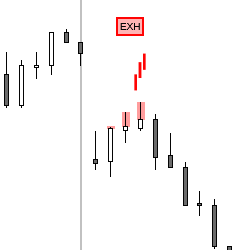
This indicator is a new approach to Price Action trading. It identifies momentum and exhaustion by examining bar features and relation to prior bars in great detail. It can be used as a discretionary indicator or for automated (e.g. BloodHound) trading. Get started with a free 20-day trial today!
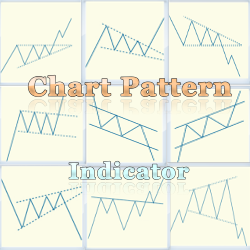
The Chart Pattern Indicator Package includes a number of pattern recognition indicators such as pennant, flag, wedge, triangle and more. The indicators can be purchased separately or discounted as a suite. Learn more!
December 2, 2024
Mastering Sideways Markets With Auction Bars and Range Projections
November 19, 2024
Enhancing Your Automated Trading System: Key Insights from Best Pro Trade
November 14, 2024
NinjaTrader New Ecosystem Tools: October 2024 Edition
Enter Email for Updates