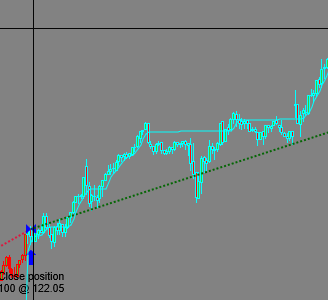
A trend following tool that can achieve exceptionally high risk/reward ratios when applied to suitable markets that trend well. Locks onto trends and does not let go until the trend ends. Not entirely suitable for novices. Strategy, paint bar and indicator included. Automated or manual operation.
This NinjaTrader indicator is programmed to highlight the big money trades. The numbers are placed under each bar which makes it easy to see where the action/noise is taking place.
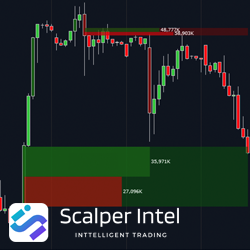
The Fair Value Gap (FVG) from ScalperIntel is an indicator that identifies inefficiencies (or imbalances) in the market and then marks the upper and lower limits of the gaps. The Bull and Bear FVG’s are plotted along with the bull/bear volume profile from the gap start.
The EPyFSwingLevels indicator identifies the most relevant structure levels. Once the indicator is loaded within a chart, it automatically reflects areas where the price reacts.
Anchored VWAP drawing tool for NinjaTrader 8. Draw your own anchored VWAP's on the fly in just two clicks, using this drawing tool. Custom start and end, custom deviation bands and line styles. Free to download and use!
Mentor one to one what you'll find inside: 8 hours of live lectures, 4 hours of live backtest, community discord lifetime live weekly backtest, weekly live review, live archive, markup price action, lifetime updates on new concepts, private structure indicator.
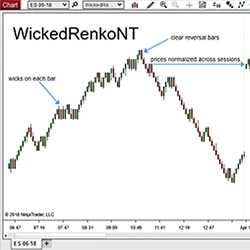
WickedRenkoNT is a custom Renko bar type which is easy to see & logical to interpret. Adding WickedRenkoNT bars to yourchart is extremely helpful in filtering noise on a chart, as well as identifying reversals. Additionally, these bars remove erroneous gaps and align bars across sessions.
Transform your trading with 'Trading Psychology Toolkit' – a concise guide offering 23 practical strategies to master trading psychology. Developed from real world experience and scientific methods, it's an essential tool for emotional control and strategic thinking in trading.
For new or current traders who wish to learn what it takes to gain knowledge and confidence to become more consistent in their trading, this course includes the following sections: Price Action Mastery Overview, Price Action Q&A Recorded Webinar, Understanding Market Sentiment & a Trader Assessment.
A trend resembles a wind: it has both direction and strength. ninZa.co researched and developed Nova Wynd as a lag-free indicator purely based on ATR and price action without moving averages or smoothing. Get it today and start seeing which way the wind blows!
December 2, 2024
Mastering Sideways Markets With Auction Bars and Range Projections
November 19, 2024
Enhancing Your Automated Trading System: Key Insights from Best Pro Trade
November 14, 2024
NinjaTrader New Ecosystem Tools: October 2024 Edition
Enter Email for Updates