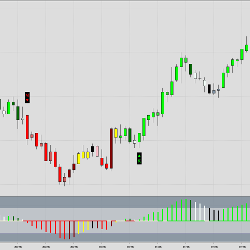
The Zerolag Oscillator is a MACD type momentum oscillator, based on two zerolagging moving averages. The indicator is designed for locating momentum and pullback entries. Momentum entries are found shortly after a trend change, whereas retracement entries focus on the middle chunk of a larger trend.
Advanced Indicators are some of the most advanced indicators currently available on the market! Get cutting-edge trading tools - encompassing years of experience in financial market research, engineering, mathematics, a.i., and data science. These unique pro tools not available anywhere else!
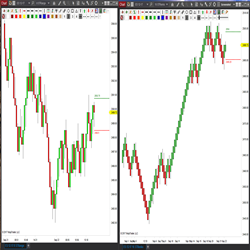
STBars are Structural Trading’s custom range and renko bars which include the STRangemanker, a tool identifying for support, resistance and trend bias. The STBars are available in NinjaTrader 7 and NinjaTrader 8. Learn more!
More Tech, LLC has over 10 years of experience working with MetaTrader, and have converted hundreds of indicators and strategies to be compatible with the NinjaTrader platform. Contact them today to receive a free estimate for having your code converted from MQL to NinjaScript.
The LogikTickX utilizes signal processing and price reconstruction techniques to cut through the noise, reconstructing the true transaction, minimizing the hiding of large orders. This allows traders to identify and react to the market sentiment, and correlation between price and volume development.
Find out how you can identify accumulation and distribution with price action trading. Spot the footprints left by “smart money” with price and volume, the Wyckoff method way, when day trading or swing trading the stocks and futures. Join today and be part of the lifetime community group.
Take advantage of IndicatorSmart’s special discounts for NinjaTrader Ecosystem users. Be sure to sign up for their Members List on their site for even more special offers and to stay informed about important trader events.
The ribbon-like indicator, Fantastic MA Ribbon, is created by plotting multiple moving averages (MA) with varying lengths. It incorporates four signal mechanisms, offering diverse options to align with your unique trading style.
Quick Trade Ninja - Break Even Plus is designed to allow you to quickly move your ATM strategy stop loss to Break Even plus or minus a certain number of offset ticks. Quick Trade Ninja Break Even Plus quick action can be configured as a chart trader button, a hotkey or both.
Cutting-edge NinjaTrader 8 Risk Reward Indicator empowers you to make informed decisions with unparalleled precision. Effortless extension, tailored risk levels, adjustable aesthetics, with free 14 days trial and 24/7 support line.
December 2, 2024
Mastering Sideways Markets With Auction Bars and Range Projections
November 19, 2024
Enhancing Your Automated Trading System: Key Insights from Best Pro Trade
November 14, 2024
NinjaTrader New Ecosystem Tools: October 2024 Edition
Enter Email for Updates