TradingCoders offers custom indicator and automated trading strategy programming services. TradingCoders possesses intimate knowledge of trading and NinjaTrader, and builds projects ranging from simple alerts and visuals, to sophisticated multi-timeframe techniques of price and cycle analysis.
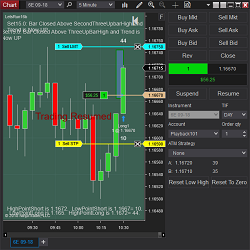
Let’s Run is a breakout strategy used for discretionary or automated trading with a Chart Trader switch. It triggers based on built-in trend finding indicators with customizable settings for stop options and reset buttons. It is fully flexible with both swing and scalp capabilities. Learn more!
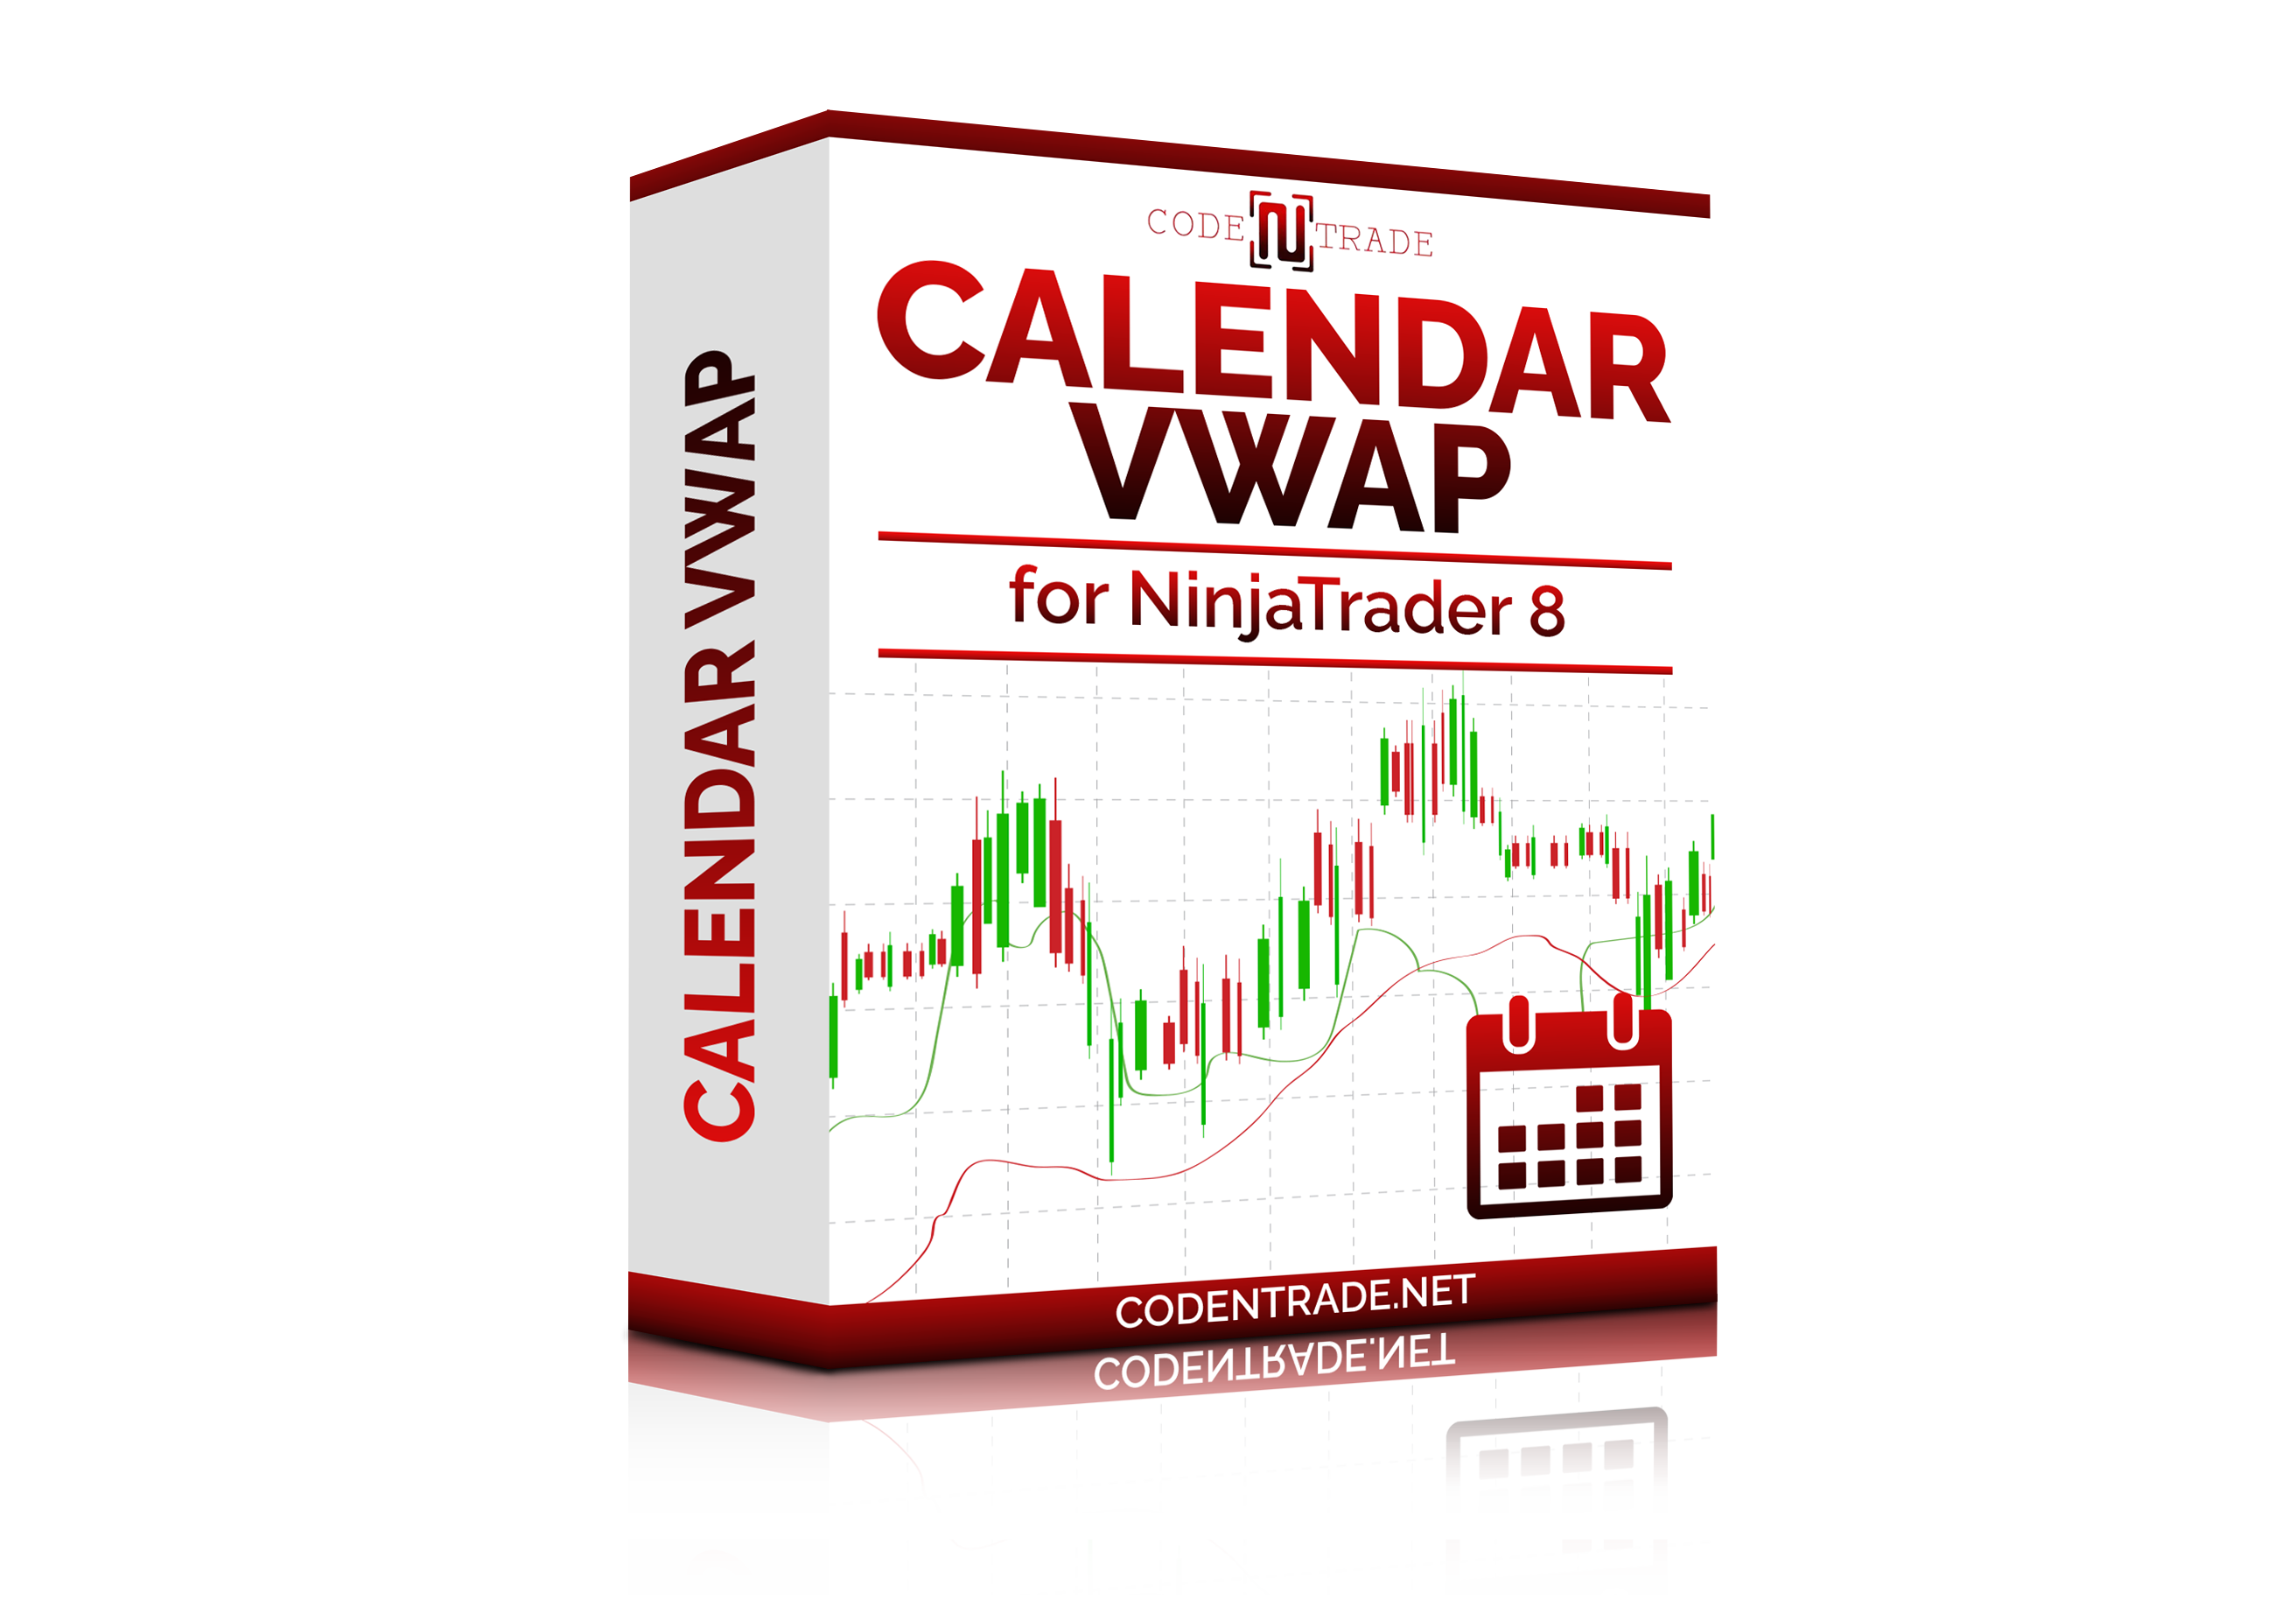
Track volume weighted average prices (VWAP) over any time frame with the comprehensive Calendar VWAP indicator, featuring customizable settings for essential periods like MTD, YTD, WTD and more!
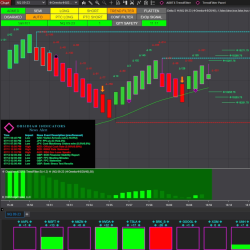
Unleash the power of automated trading with the Obsidian Indicator Suite for NinjaTrader 8. A collection of innovative indicators, including the Automated Dark Diamond Trend Sniper, specially designed for precision and adaptability in different market conditions. Start your 7-day free trial now!
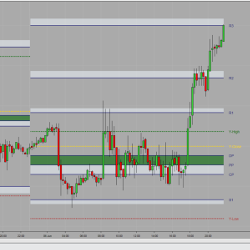
Session Pivots are a well known trading technique to calculate intraday support and resistance points. Because of its simplicity and efficiency, it is still a very reliable method for determining key support and resistance levels.
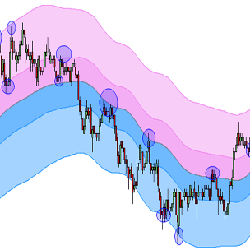
A remarkable price channel, with a proprietary formula that is adaptive to market conditions and reveals dynamic support and resistance levels. TC_NovelChannel paints two colored bands which show a consistent tendency to provide support and resistance to price, for any instrument or time-frame.
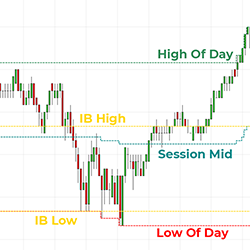
Initial balance, session mid & day mid are common market profiling levels used in day trading futures, stocks & ETF’s. This indicator automatically plots and updates these levels on any intraday chart, providing clear targets for trade entries & exits. Get started now and enhance your charts!
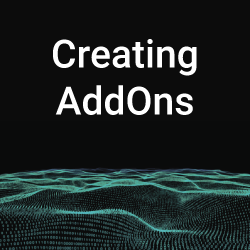
In this course you will learn how to code add-ons for NinjaTrader 8. It consists of over 10 lectures on how to create custom windows, pass data from strategies into add-ons, create beautiful charts using 3rd party libraries and use statistics to find new ideas for building systems.
The AVALON Strategy is a relaxed long-term End-of-Day (EOD) trading strategy for the Futures Market. It requires minimal effort and is ideal for traders who like to take it easy and keep things as stress free as possible. Test the AVALON Performance now with the Online Backtester!
Streamline your trading with semi-automated tools that efficiently manage positions, whether long or short, across specific instruments in your account.
December 2, 2024
Mastering Sideways Markets With Auction Bars and Range Projections
November 19, 2024
Enhancing Your Automated Trading System: Key Insights from Best Pro Trade
November 14, 2024
NinjaTrader New Ecosystem Tools: October 2024 Edition
Enter Email for Updates