The Elliott Wave Indicator Suite is designed around a simple but effective swing trading strategy. The indicator suite is great for stocks, futures and forex trading on multiple time frames.
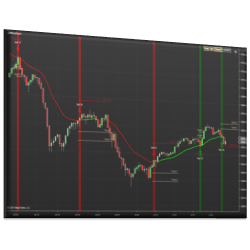
This indicator plots signals, targets, and stops based on support and resistance from various moving average types. The trend is established based on a minimum number of bars above or below the moving average. The signal is initiated on the first touch of the moving average.
3 Day Cycle (a.k.a. Taylor Trading Technique) was invented by George Taylor. His core premise was that the market is manipulated in stages. Now traders have access to an “Electronic Trading Book” via spreadsheet emailed daily.
A unique course with a specific, rule-based & mechanical/objective trading methodology. Designed to help traders identify entries & exits, define size, manage risk and control emotions when trading Forex Markets with their own characteristics & terminology. Get FREE access to the patented AutoUFOs®.
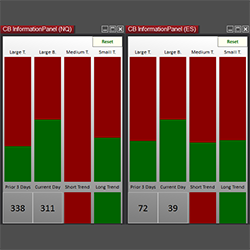
CB Information Panel gives you a snapshot of the buyers and sellers. Keep track of the prior day’s ranges and trend movement.
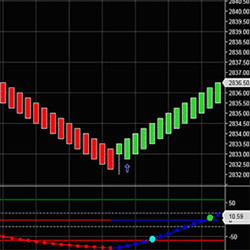
TrendLine Indicator plots red and blue lines to determine the trend. Easily detect the trend direction in any markets so you can easily find ideal trade setups. The red and blue arrows confirm the trend directions and plot above and below the candles.
Learn how to build a backtested trading strategy with a known edge using the strategy development lifecycle process. You will be taking an Idea to an actionable trade plan! Start trading live with a tested strategy that can be adapted to futures, ETFs and options of S&P 500 and Nasdaq 100 Indices.
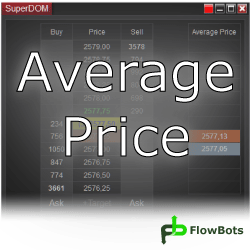
The SuperDOM Average Price Column shows a position average price accumulated since the first order execution. All opened and closed executions from the beginning of the position are used for the calculation. Save time by knowing your current position's average price for all of your past entries!
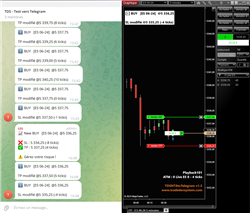
This indicator will be responsible for sending on your telegram channel your positions taken using ATM.
Highlight the Value Area (VA) & Point of Control (POC) of every single candle on your chart, or filter candles with high volume only. The Value Area is colored by the Bid/Ask delta. Get started with a free 7-day trial today!
December 2, 2024
Mastering Sideways Markets With Auction Bars and Range Projections
November 19, 2024
Enhancing Your Automated Trading System: Key Insights from Best Pro Trade
November 14, 2024
NinjaTrader New Ecosystem Tools: October 2024 Edition
Enter Email for Updates