By subscribing to our Indicator Spotlight traders get a free monthly download from the LizardIndicators indicator library. All indicator features are documented with an explanation on how the indicator can be used in a trading strategy. Sign up today!
Trend lines, swing pivots, and price patterns are simple price action trading tools that seasoned traders use daily. Day Trading With Price Action, by Galen Woods, is a high-quality trading course that teaches how to effectively trade via price action analysis. Download a free chapter today!
Find out how you can identify accumulation and distribution with price action trading. Spot the footprints left by “smart money” with price and volume, the Wyckoff method way, when day trading or swing trading the stocks and futures. Join today and be part of the lifetime community group.
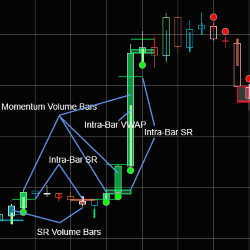
Every bar contains information. You miss a lot of valuable information due to filtering bars by time, variance or some other method. The best solution is to allow these bars to provide you with all the valuable and needed information in a compact and informative manner.
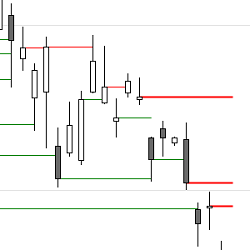
On instruments with regular trading hours you often see gaps on a chart which stay open for more than a day. A couple of times a month these open gaps from prior days also play an obvious role as support or resistance on the intraday chart. These tools are free to download and use!
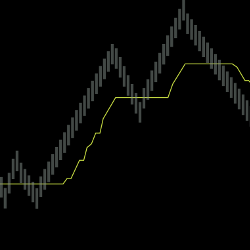
The LogikUltimateRenko is a completely customizable improved variant of the traditional Renko bar type. It has the added options to set the Open Price Relation (to the prior bar), as well as a more precise Reversal Brick Size control. Check out a video demonstration of LogikUltimateRenko in action!
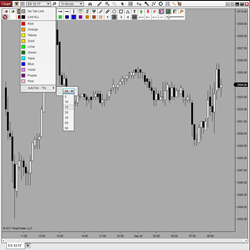
Auto Tab adds a Tab Link Selector to the top left portion of every Dom & Chart window. Simply click on the tab of any window, and all other windows (linked by color) will also change to that same tab! Simulate multiple workspaces with tabs and enable automatic sequencing with a configurable timer.
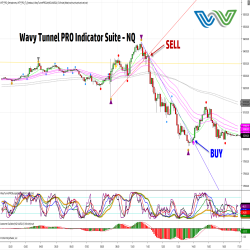
The Wavy Tunnel PRO ELITE Scanner Tools and Market Analyzer simplify finding trades. Set chart alerts for easy monitoring. The ELITE Tools save time by highlighting trades with visually appealing setups in line with the market cycles. Good for momentum, day and swing trading on all asset classes.
Get information about the development of a dynamic and descretionary trading model. This is intended to inform people of a coaching program tailored to their specific needs in order to make them more consistent traders.
The Zerolag HATEMA is based on a TEMA that uses Heikin-Ashi candles as input series. This indicator does not depend on the selected input series, as it uses open, high, low and close of each candle.
December 2, 2024
Mastering Sideways Markets With Auction Bars and Range Projections
November 19, 2024
Enhancing Your Automated Trading System: Key Insights from Best Pro Trade
November 14, 2024
NinjaTrader New Ecosystem Tools: October 2024 Edition
Enter Email for Updates