Simplify your trading process! The Elite Indicators predict major tops and bottoms, diagnose the direction and strength of price action, and calculate the best stop-loss and profit-target levels! Try a 30-day demo today!
Get daily Volume Profile trading levels, monthly swing levels, signals and video! This is a video guide to Trader Dale’s daily levels with access to the member forum. It also includes custom-built Volume Profile indicators for NinjaTrader 8.
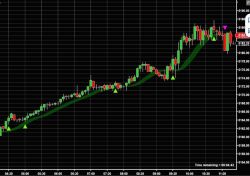
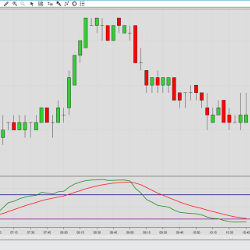
As a companion to our Trend Ribbon indicator, we offer the Trend Buy / Sell Signal. This works with The Trend Ribbon allowing you to select entry and exit points with confidence based on interpretations of the graphics. Fully adjustable to your style of trading: intra-day, swing or longer.
The algorithm works by continuously processing live data such as time & sales, volume, tape pace and tape acceleration. The algorithm performs real-time analyses, dynamically adapting to identify aggressive buyers and sellers actively influencing the market.
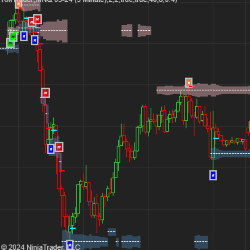
This cutting-edge indicator harnesses the power of Volume, Ranges, and an array of other metrics to pinpoint Key market levels. Brace yourself for a revolutionary approach that goes beyond mere pivot points. This indie is ideal for trading breakouts and reversals. Also efficient at setting PT & SL.
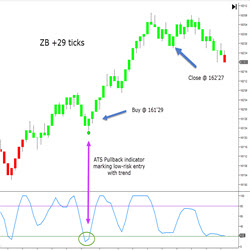
The TrendContinuation indicator identifies and alerts the trader of high probability continuation trades in the direction of the major trend. Using a time tested algorithm for determining possible low risk entries, this indicator marks the location and can notify the trader via email or text.
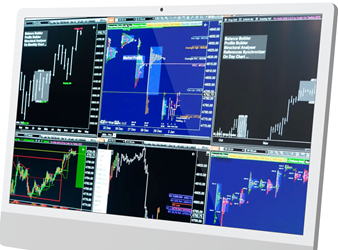
Elevate your trading with the ultimate toolset. The gold plan includes 9 NinjaTrader indicator modules and 13 NinjaTrader drawing tool modules. Seamlessly communicate between market profile and other charts. Utilize the top down approach analysis for daily, weekly, monthly and short-term charts.
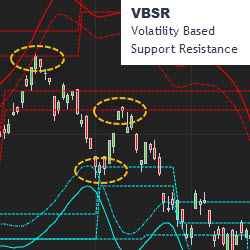
MetaSwing plots the hidden structure of support and resistance in real-time. VBSR (volatility based support resistance) makes this visible in advance, in all timeframes. Markets are non-linear and your tools should be as well. It’s not your father’s TA. Trial MetaSwing.
Enhanced Decision-Making; Trading Awareness/Behavior. Basic Training accelerates improvement by strengthening behaviors causing the brain to filter, process, and apply information most effectively. Psychology, sociology and neuroscience are integrated to keep decisions ahead of price movement.
The Slow Relative Strength Index is an adaptation of the classic RSI calculation, customized for use in higher timeframes. The slow RSI calculation compares the close price with an exponential moving average instead of the previous value.
December 2, 2024
Mastering Sideways Markets With Auction Bars and Range Projections
November 19, 2024
Enhancing Your Automated Trading System: Key Insights from Best Pro Trade
November 14, 2024
NinjaTrader New Ecosystem Tools: October 2024 Edition
Enter Email for Updates