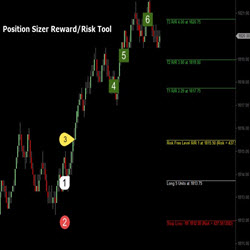
This tool auto-calculates position size based upon account value and percentage risk parameters input by trader. Displays the Entry Price, Stop Loss, and up to Three (3) Price Targets based on R-values. If you a serious trader, then this is an essential addition to your trader toolbox.
High rated Quant Developer/Trader specializing in NinjaTrader. They have worked with high profile clients/organizations and have professional experience working at an Algo trading desk. They focus on providing value to all their clients and earning their trust.
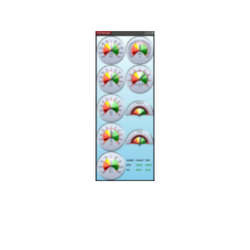
The CB Internals Panel shows you the breadth of the market long and short term. Combined with custom audio alert, it lets you know when the market is moving. It has been in development since 2016, and the current version stands alone.
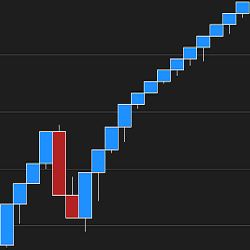
Say goodbye to fixed brick sizes! Optimal Renko Bars' advanced logic auto-selects the smoothest-fit Renko bars for your chart in real time! Dynamic, self-adjusting bar type that responds to today's market.
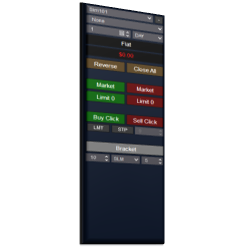
The Bracket Entry Orders module is great for capturing momentum in fast moving market during periods of high activity or following a news event. The “Bracket” button gets the last traded price and initiates a buy order above the market and a sell order below the market simultaneously.
The Breakout Blitz is a full user and discretion controlled tool for traders, built by traders. Available on Ninjatrader 8, this tool can help eliminate your range trading, sitting and waiting dilemma. Once you identify a range, place your breakout box over, choose your direction and go!
Highly sought after day trading strategy and methods course. Featuring the successful "Ultimate 25Bar, Ultimate Backdoor, and Ultimate Slingshot" systems. Complete with over 65 videos and more. Over 13 years strong. Includes access to our Ultimate Scalper group chat and text support.
Boost your trading with the OTS indicator collection! Includes key tools like average profit/loss, market spread, and more for enhanced market analysis. Ideal for every trader. Start now!
Passionate trader in couple who help you in understanding the pure reading of the heavy and light future market using the DOM TAPE. Different tools are available with help also on these. Mutual help and personalized support right through to the end.
Recently updated, the Conway Market DNA Day Trading System now includes Auto Strategy Trade Entry and Exit and a simplified Order Flow which projects 1 bar into the future. Also included is our Chop Filter Indicator, which will not take trades in a choppy market, and a 236-page product manual.
December 2, 2024
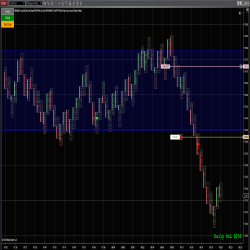
Mastering Sideways Markets With Auction Bars and Range Projections
November 19, 2024
Enhancing Your Automated Trading System: Key Insights from Best Pro Trade
November 14, 2024
NinjaTrader New Ecosystem Tools: October 2024 Edition
Enter Email for Updates