Don't miss any more targets by a few ticks with Target Zone!
A unique course with a specific, rule-based & mechanical/objective trading methodology. Designed to help traders identify entries & exits, define size, manage risk and control emotions when trading Forex Markets with their own characteristics & terminology. Get FREE access to the patented AutoUFOs®.
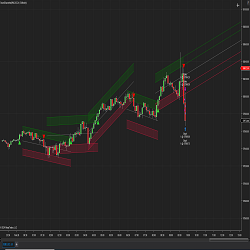
Channel levels are defined based on high and low prices influenced by candlestick bodies. These points are calculated based on the defined channel levels and look back periods. Delta values are computed to determine the channel's upward or downward slope.
Become a master of Nison Candle Scanner (NCS) with this next-level training. The step-by-step program enables traders to personalize NCS for their individual needs. Students learn to intelligently automate routines with advanced NCS tips, tricks, and strategies. Register for immediate access!
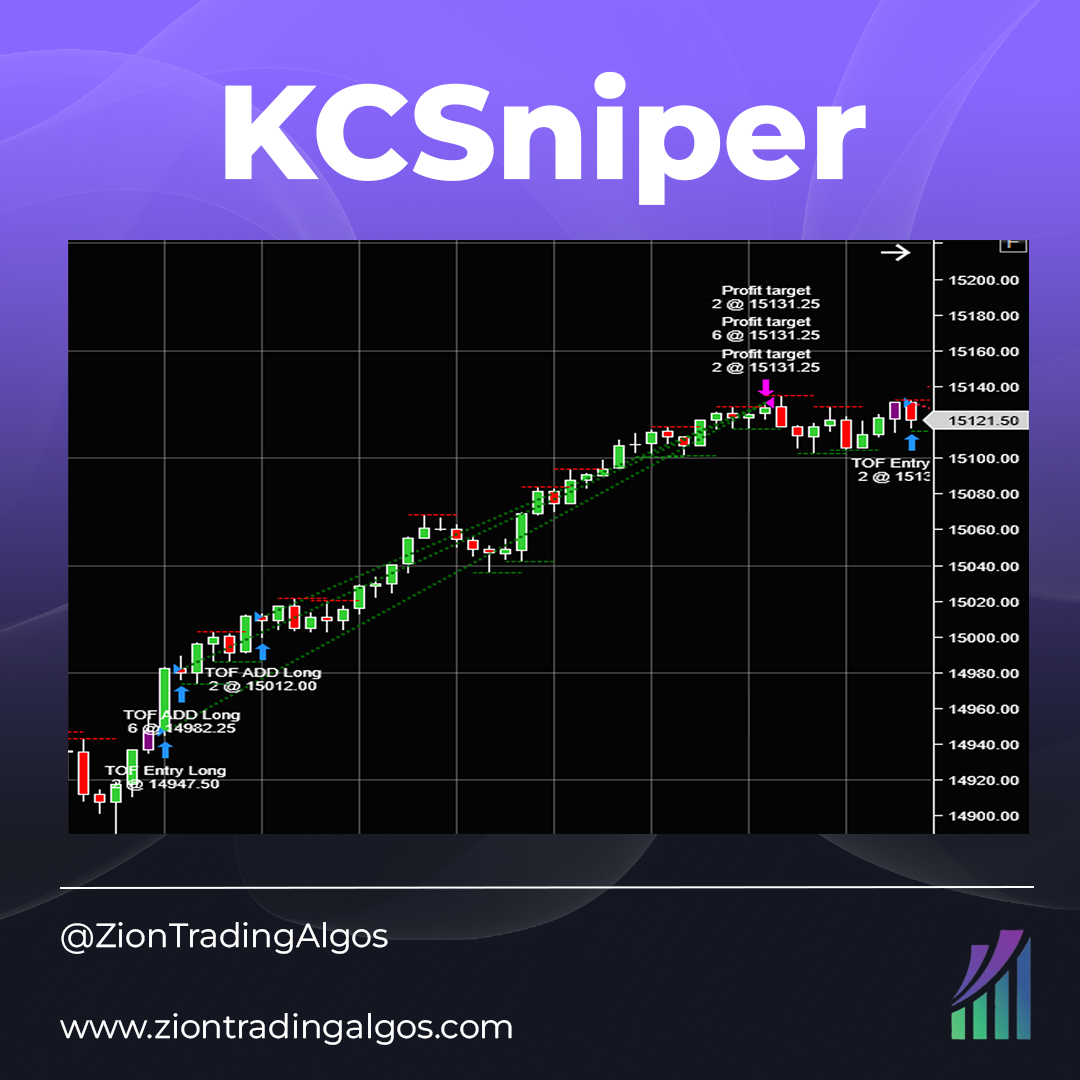
KCSniper is a Keltner Channel-based system on the 10-minute chart. It is long only and does not pyramid into positions, but has a single entry and exit model. It uses volatility based stop loss and take profit targets to remain adaptable. Trades MES and MNQ.
The ELITE Pack includes 44 in-depth Volume Profile training videos, 15 hours of video content and hundreds of real trade examples. Get intraday & swing Volume Profile levels, signals & video! It also includes access to the member forum and custom-built Volume Profile indicators for NinjaTrader 8.
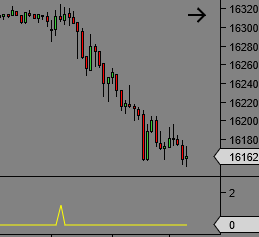
Unlock the power of divergence in demand index with this simple to use translation of the interpretations of 20 different variants all combined in one. Often finds the exact peak of the day or week or month in real time. Newly released to join the other version on here. Works in any time frame.
The TradingFuturo Order Flow toolset consists of several advanced indicators which allow the technical analysis of markets through the Order Flow technique. It is robust and high-quality software, validated by a large community of traders.
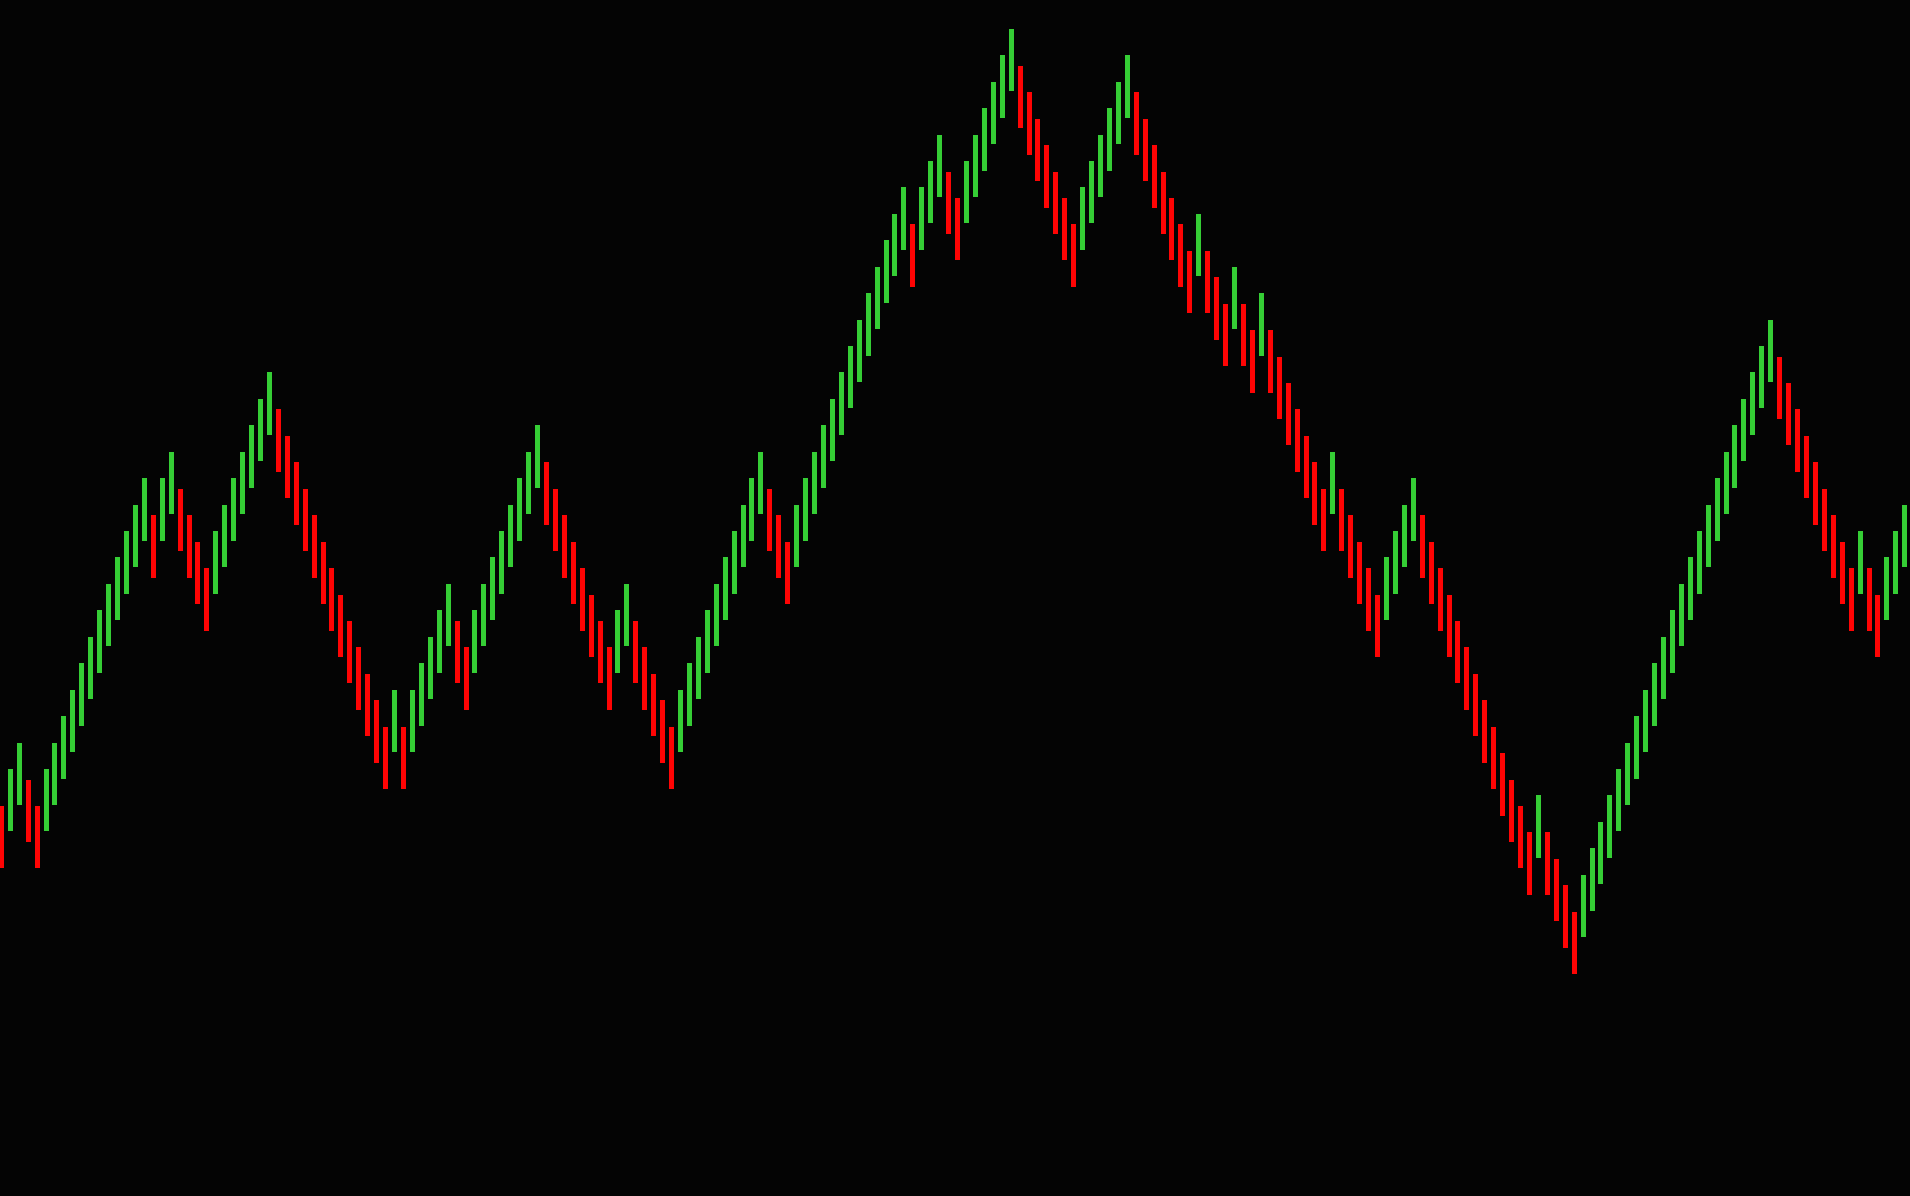
The "Qrenko" is their custom renko brick. This indicator helps traders see trending price action more clearly by smoothing out traditional candlesticks into "Qrenko" bricks. Traders can adjust the shift, offset, and range of the brick settings to suit their specific trading style.
A fantastic way of using the Quotes Delta setting on Bookmap.com to identify whether important support and liquidity levels will hold or break, the Sweep Show setup has helped Nic understand when it was time to fade a move or go with it in E-mini S&P 500 futures.
December 2, 2024
Mastering Sideways Markets With Auction Bars and Range Projections
November 19, 2024
Enhancing Your Automated Trading System: Key Insights from Best Pro Trade
November 14, 2024
NinjaTrader New Ecosystem Tools: October 2024 Edition
Enter Email for Updates