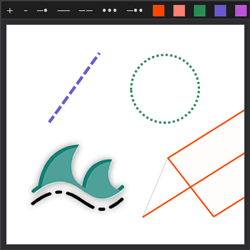
This indicator allows the user to change the color, stroke style and stroke size of drawn objects on the fly without having to dig through various menus. This increases application functionality and user charting efficiency.
Learn how to approach an active risk-based portfolio management trading multiple instruments at the same time. You will learn to design a diversified portfolio and equip yourself with the right tools, processes, and mental framework necessary to be successful at managing it. Get your blueprint now!
If you're serious about learning to trade forex, this is the program for you. It includes all the knowledge and tools you need to succeed as a forex trader, and all taught in live markets with two seasoned traders. So grab your seat now, and start trading with confidence.
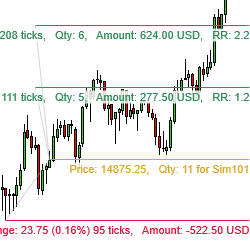
Calculate your position size automatically by drawing a stop loss and entry and target levels on your charts – and, optionally, submit the associated orders. When the instrument currency is different than the account currency, it automatically calculates all amounts in the account currency.
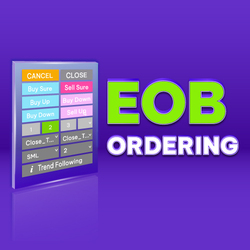
EOB or End Of Bar is an amazing close-bar order tool that is nowhere else to be found. This amazing add-on works with any bar types. Let EOB Ordering play the tough game for you, as it was designed to reduce the ordering time to just a few milliseconds.
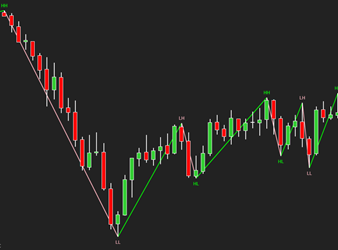
The ZigZag indicator is primarily used to identify significant highs and lows in the price chart, which helps traders filter out market noise and focus on important price movements.
Q-ProTrader is a fully integrated day trading automated strategy which trades the E-mini futures contract. This package includes both the Q-ProTraderIndicator and Q-ProTraderStrategy.
The Zerolag HATEMA is based on a TEMA that uses Heikin-Ashi candles as input series. This indicator does not depend on the selected input series, as it uses open, high, low and close of each candle.
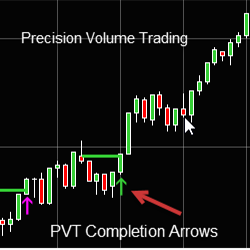
Precision Volume Trading Completions Arrows helps traders determine if the market will move up or down.
The Bell Order Flow-PRO is a toolkit of optimized order flow and volume visualization. It offers some of the unique features like BidxAsk Ladders, High Volume Alert, Volume Imbalance, Volume Spread Analysis, Delta Candles, Volume Profile, COT, Contract Reversal and customizable chart colors.
December 2, 2024
Mastering Sideways Markets With Auction Bars and Range Projections
November 19, 2024
Enhancing Your Automated Trading System: Key Insights from Best Pro Trade
November 14, 2024
NinjaTrader New Ecosystem Tools: October 2024 Edition
Enter Email for Updates