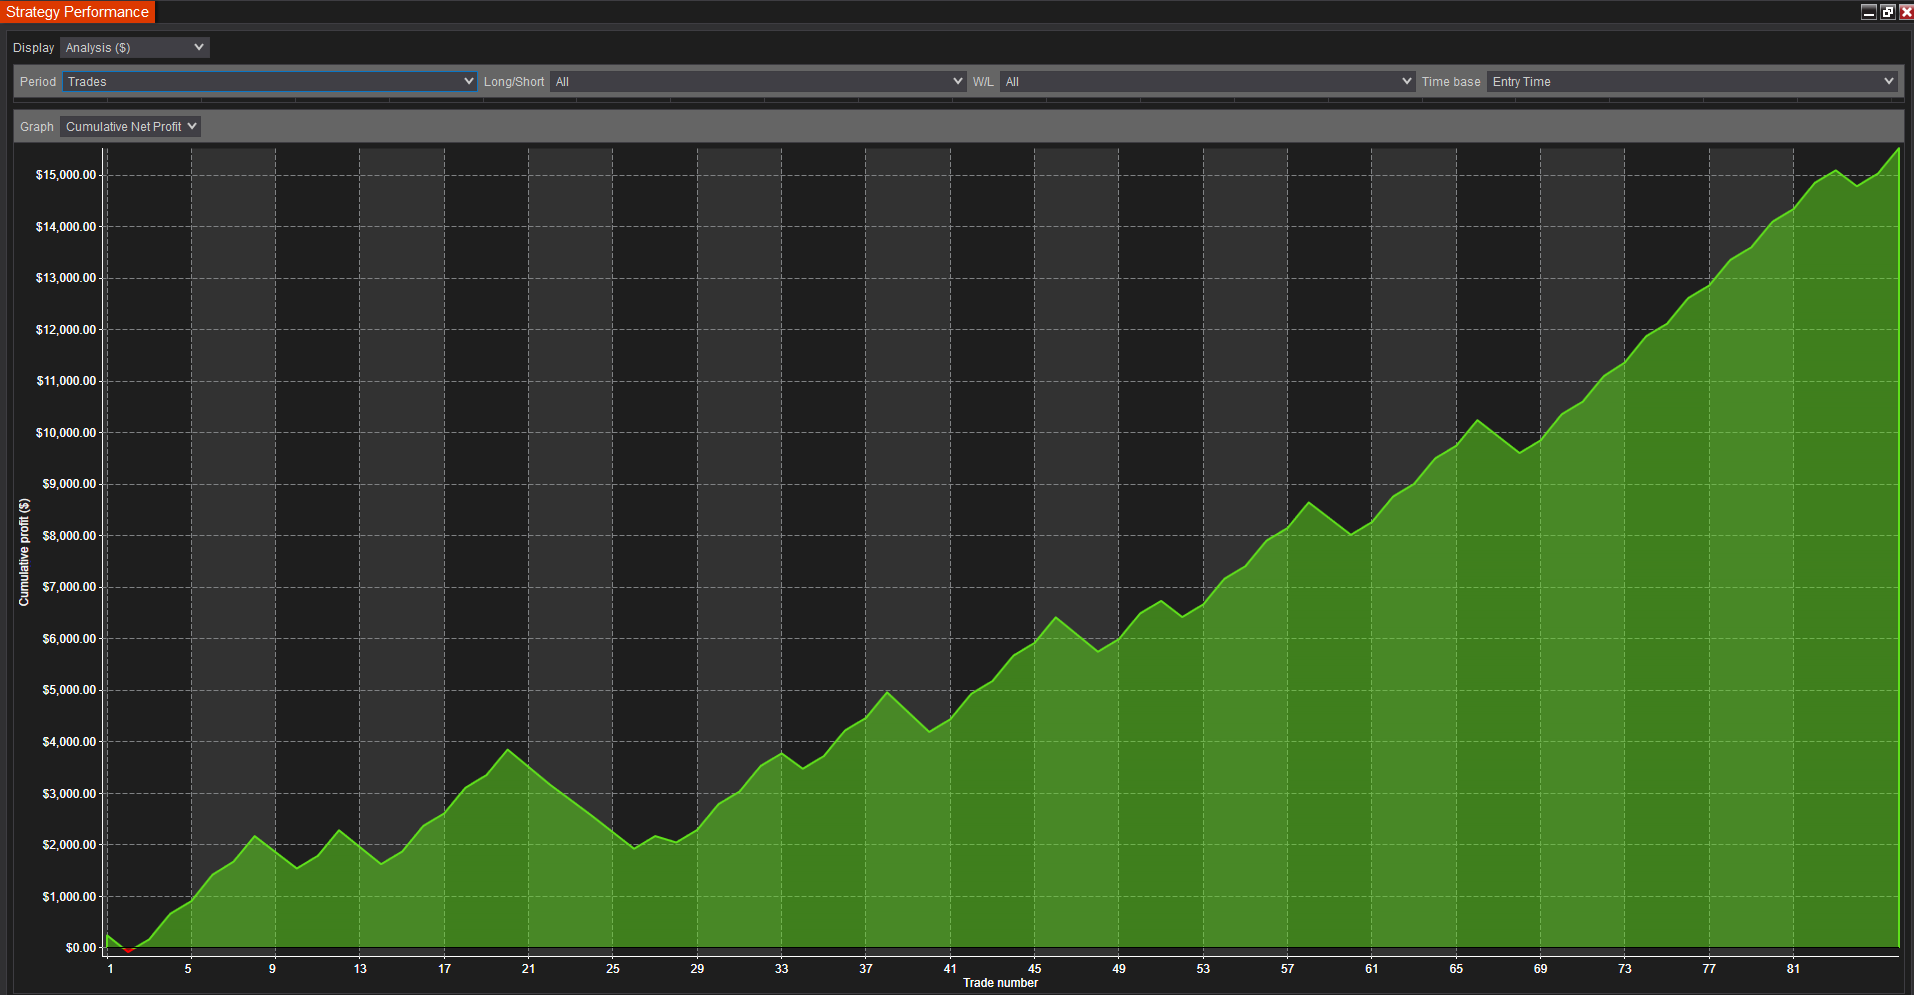
HelloWin Backtest is a revolutionary trading analysis tool offering an intuitive PnL graph for real-time system evaluation. Supporting various bar types, slippage adjustments, and a unique two-round logic for defining entries, it mirrors the strategic approach of professional traders.
Denotes fitness functions in the NinjaTrader 8 platform, evaluating trading strategies' performance. By leveraging specific parameters, they assist traders in analyzing, comparing and selecting the most effective trading methodologies.
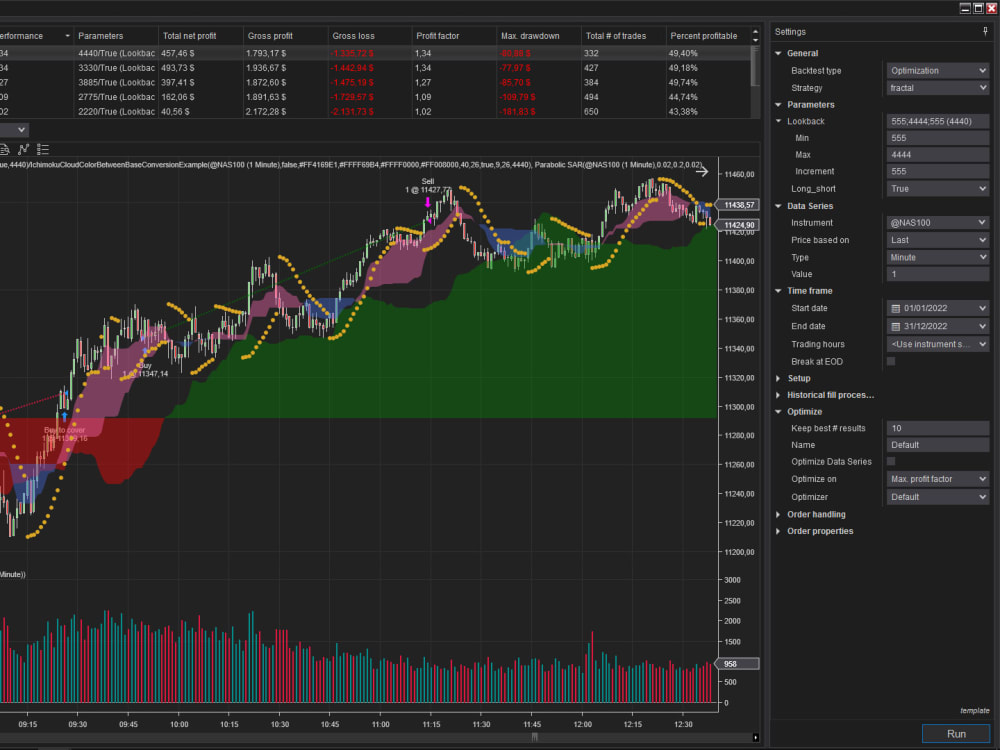
This is a fractal trading strategy for NinjaTrader 8 that uses Ichimoku as well other indicators for confirmation. It’s running on the latest version of NinjaTrader.
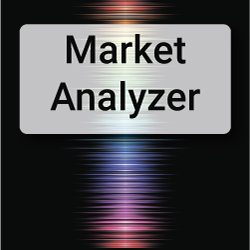
Market Analyzer 96 Trade Systems is a framework of 96 easy-to-use trade systems to test market conditions. With this course you will be able to extend the provided framework and use it as a powerful tool for building trade systems.
The Roller Coaster is a Stochastic/MACD cross indicator with special EMA Points of Control for both long and short trades. Our algorithm works everything out behind the scenes, keeping your chart clean.
T2SSupplyDemand is an indicator used to enter high-probability trades. Get notified in real time by email, text message or your favorite sound when the price is about to enter key zones & when it touches fresh zones. Don't stare at a screen, wait for the right signal in supply and demand zones.
Activity Bars is a unique bar type for NinjaTrader which accounts for every single trading activity. Activity Bars establish both nature price action and trend. They work well in choppy markets by accumulating trading activities of ranges and zones, but also work for trending markets.
The Tradesight Plus Subscription includes access to their live Trading Lab, a suite of ten NinjaTrader add-on tools, plus all their stocks, futures, Forex, and options calls throughout the day. The subscription also includes the Tradesight Forex and Futures Levels.
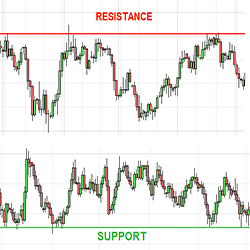
Plots chart and/or synthetic support and resistance lines from a higher time frame.
Introducing the NQ Destroyer: Revolutionize your trading strategy. Unlock the power of precision trading. Are you ready to take your trading to the next level? Meet the NQ Destroyer, the ultimate trading bot designed to maximize your trading potential with precision and reliability.
December 2, 2024
Mastering Sideways Markets With Auction Bars and Range Projections
November 19, 2024
Enhancing Your Automated Trading System: Key Insights from Best Pro Trade
November 14, 2024
NinjaTrader New Ecosystem Tools: October 2024 Edition
Enter Email for Updates