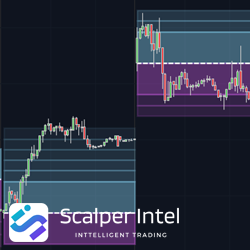
The Angels and Demons Indicator shows current and past support and resistance levels. It can be applied to multiple time frames, making it suitable for swing and position traders as well as day traders. Easily visualize important price levels where longs and shorts attempt their defense!
Elevate your trading strategy with the Day Range Zones Indicator for NinjaTrader 8. Calculate potential daily trading ranges from the opening price using historical data and standard deviations. Identify key support and resistance areas, manage risks, and anticipate price movements.
Track NYSE and NASDAQ market breadth divergence directly from your price chart - even on Renko bars! Optimal Breadth seamlessly integrates advance-decline internals with your price chart and plots three intraday divergence types: classic, hidden and micro. Never miss a signal again!
Learn a battle-tested strategy for trading the markets in under 60 mins per day. Here’s just a fraction of what you’ll learn: How professional traders find good trades, how to read the markets and a market that has unique advantages over others.
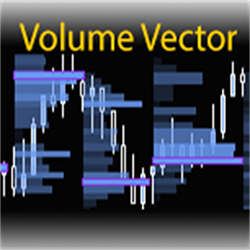
The Volume Vector tool creates automatic volume profiling of price action swings. Increase trading consistency and see exactly where trades have been initiated!
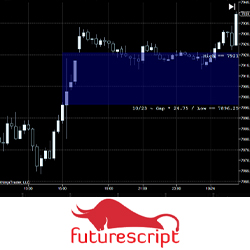
The Gap indicator was designed to illustrate when dramatic price disconnects from one period to the next when the market establishes critical levels. This indicator has been carefully constructed to explore different perspectives and trading approaches related to the gap in intuitive ways.
Weekly long form insights on the markets with weekly and twice daily algorithmic levels coupled with intraday NQ, ES and CL trading journal.
Patternsmart custom programming services aim to provide fast and efficient solutions to all customer requests. Primary services include custom alerts, automated, trading, SuperDOM and Market Analyzer columns, indicators & more. All custom scrips include a free 1-year bug fixing service!
Indonesian-speaking. This channel is a place to learn forex, crypto and stock trading using ICT methods. Make daily analysis, design trading plans correctly and measurably.
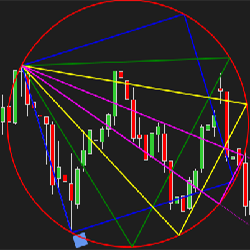
We are pleased to bring NinjaTrader users this tool typically reserved for expensive institutional platforms. The Gann Emblem is a drawing tool for those familiar with its applications, especially traders of the Gartley method.
December 2, 2024
Mastering Sideways Markets With Auction Bars and Range Projections
November 19, 2024
Enhancing Your Automated Trading System: Key Insights from Best Pro Trade
November 14, 2024
NinjaTrader New Ecosystem Tools: October 2024 Edition
Enter Email for Updates