Automated trading for the S&P 500, Indices, ETFs, Stocks and Cryptocurrencies. Discretionary trading indicators. The RD3 uses a two stage system for identifying profitable swing trading opportunities.
ChartIdentifier renders instrument information directly on the chart to assist with easy chart identification. Choose what instrument format you want to display and optionally add a prefix value.
The CB Internals Panel shows you the breadth of the market long and short term. Combined with custom audio alert, it lets you know when the market is moving. It has been in development since 2016, and the current version stands alone.
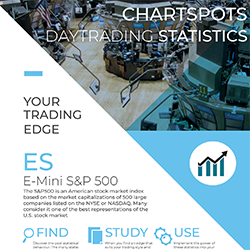
Use Statistics to determine intraday High Probability Targets and place stops outside of the regular market noise. This includes Stats on Initial Balance, Mid, Session & Extension ranges, as well as 1-minute rotations & many more! Available for ES, NQ, FDAX & FESX. Download your free report now!
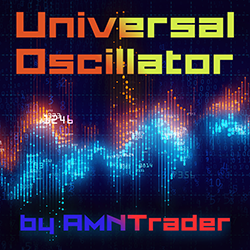
Universal Oscillator is an indicator that operates on the general principles of the RSI, CCI and OsMA oscillators. It helps you to identify potential upcoming reversals based on the values of the oscillator.
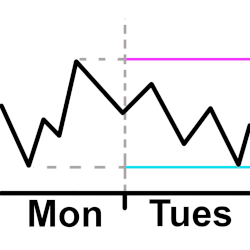
Plot a horizontal line for the high and low from the previous intraday. The user configures the open and close time they want to use for the intraday hours. This means the user can plot the high and low starting 30 minutes before the actual open and after the actual close if they want to.
The indicator illustrates volume delta for each bar, emphasizing the contrast between buy and sell volumes. With compatibility for historical and real-time data, it offers diverse display modes. Importantly, users can filter volumes to uncover distinctive behaviors among specific trader groups.
This savvy tool is for any intraday trader who draws lines and prizes accuracy when plotting, templating and reviewing line break information across multiple intraday timeframes. Our template tool also features the 5 standard next-gen and time saving features of the CT_Signature Fan Series.
The EnlightCoders HeadScalper gives you market direction with a traffic light plot – red or green. SAT (Scalp Auto Trend) is a versatile and self-adapting tool to identify what is happening in the big picture. It reduces noise with smart filters and shows just one thing: the trend in red or green.
Kwikpop 6 brings the trend of any market into clear view utilizing a combination of 26 proprietary indicators to find potential entries and exits. The Dynamic Power Tools are designed to remove the noise from charts and clearly show the trend.
December 2, 2024
Mastering Sideways Markets With Auction Bars and Range Projections
November 19, 2024
Enhancing Your Automated Trading System: Key Insights from Best Pro Trade
November 14, 2024
NinjaTrader New Ecosystem Tools: October 2024 Edition
Enter Email for Updates