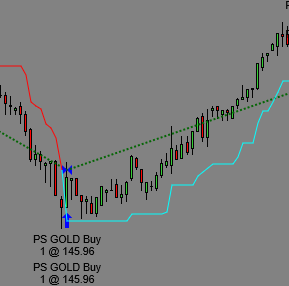
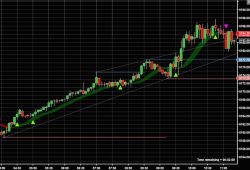
Latency protection is built in to protect you during fast moves. Trend following technologically advanced product with a complex algorithm that adjusts stop distance. SAR type operation. Not to be confused with other SARs that don't change trend until the bar closes. This does it in real time.
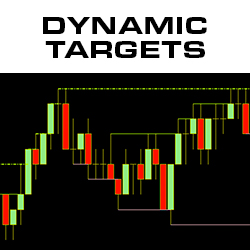
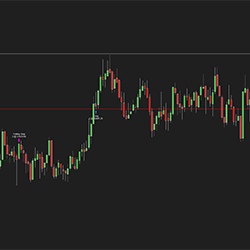
The Dynamic Targets indicator draws real-time lines at price points which serve as support and resistance, as well as entry, exit and stop adjustment targets. The data boxes provide key information to determine the relative strength of each support/resistance line. Download Dynamic Targets Today!
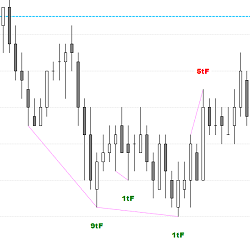
This indicator is a new approach to Price Action trading. It shows Tick Failure Breakouts above swing highs and below swing lows, which can act as support/resistance. Use the Tick Failure Breakout indicator as a discretionary indicator in your Day Trading. Get Started with a free 2-week trial today!
Tacheon Warp is a leading time-based indicator which analyzes markets and projects predictive time-based signals on the right hand side of the chart. Buying and selling pressure signals appear in the future, alerting users to the possibility of moves that have a likelihood of occurring.
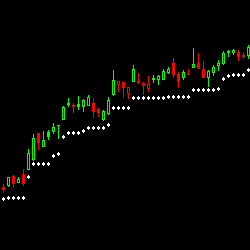
Based on ATR our Trailing Stop indicator has been designed to take all the hassle out of calculating and re-calculating your ‘stop losses.' It does this for you automatically. It also alerts if your stop is hit. A must for day and swing traders.
Bold Bot is a strategy for NQ which will analyze the product for long trades.
Learn to trade using a proven righthand trade method by trading two hours a day. 20 hour-long face-to-face sessions. Sessions are captured on video for repeat viewing. Includes candle patterns, harmonics, geometry and an intro to forecasting.
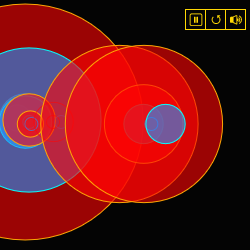
Hear, see and feel the market! A multi-sensory, audio-visual experience of reconstructed trades being executed at every moment. It uses high-performance audio processing technology and an uncluttered visual representation of each trade to give a sense of the pace and size hitting the tape.
3 indicators in 1! The C-Dash is a customizable, check-list style dashboard that comes with The Chompsky Bands Pro and Chompsky Fibs. Includes current ATR Current BPMs (bars per minute), an algorithmically weighted color wheel (weighting is customizable), and more.
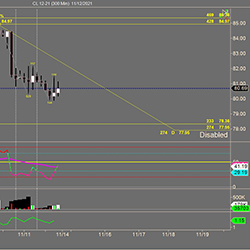
Trend Support & Resistance works great as a companion to the Trend Ribbon & Buy/Sell indicators. This indicator identifies support & resistance levels plus forecasts highs / lows. Helps you predict upcoming reversals with confidence. Adjust to your style of trading: intra-day, swing or longer.
December 2, 2024
Mastering Sideways Markets With Auction Bars and Range Projections
November 19, 2024
Enhancing Your Automated Trading System: Key Insights from Best Pro Trade
November 14, 2024
NinjaTrader New Ecosystem Tools: October 2024 Edition
Enter Email for Updates