A comprehensive package for both beginners & intermediate traders. It has been designed to help you towards building or understanding strategy construction. This will help you trade sustainable, scaleable and reproducible strategies with conviction to achieve consistent performance.
Larry Cheung’s investment community provides investment research regarding U.S and Chinese macroeconomics and company-specific fundamental analysis. He also uses technical analysis and order flow to best understand risk/reward for entries and exits across different timeframes.
Join this Futures Trading Discord! Learn to trade futures, ace prop evaluations, utilize automated strategies, and engage in live trading. Aspiring traders face challenges in meeting evaluation criteria, and they're here to help you not only pass but excel in these assessments.
Price action in relation to volume. Studying these variables establishes the equilibrium of supply and demand, as well as the possible near-term direction of the market. Don't just measure volume - measure volume that can anticipate a potential change in trader sentiment!
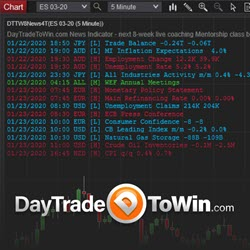
Download our FREE news indicator to see upcoming/scheduled financial news events plotted right on your chart. News events can cause sudden volatility and losing trades. Use this tool to stay informed. Watch the "Trading the News" video: https://daytradetowin.com/educational-trading-videos
The FiReZ Trading Strategy is an original and modern refinement of Fibonacci technical analysis. This Fibonacci trading strategy may be the last strategy that you'll need to learn. Stop making trading complicated and learn how to analyze and trade in a simplified, structured, and repeatable system.
CB RangeLevels 2.0 can be used both for support and resistance and for breakout / momentum trading. The main idea is to keep you with the trend to the upside or downside. Trade in the direction of the painted bars using the middle bars as support and resistance.
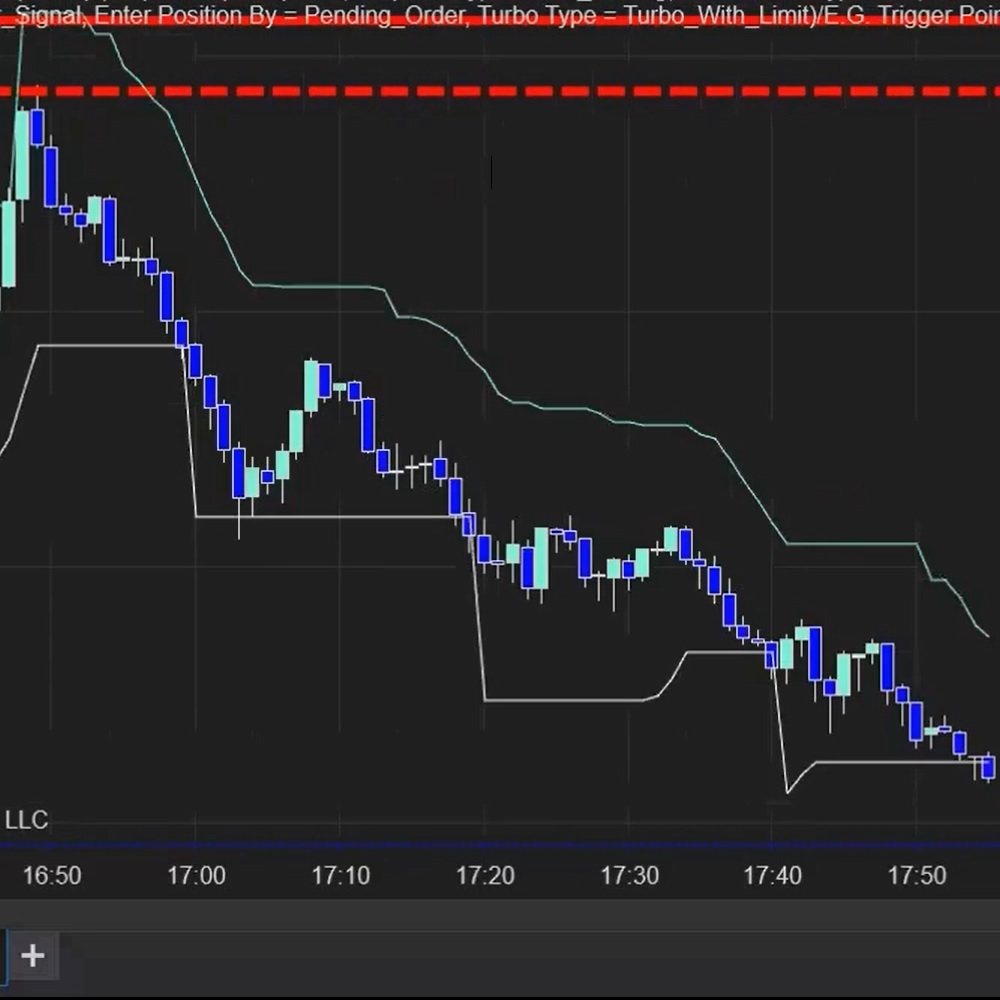
The E.G. Trailing Stop draws the trailing path for you. It considers the asset’s volatility; based on the Average True Range (ATR), it estimates the next price level to optimize your profit targets.
The Builder Blocks NinjaTrader courses will provide a good foundation in NinjaScript programming. Learn to create your own indicators and automated strategies. Recorded lessons permit you to work at your own pace. Let us help you start your NinjaScript programming.
Learn a battle-tested strategy for trading the markets in under 60 mins per day. Here’s just a fraction of what you’ll learn: How professional traders find good trades, how to read the markets and a market that has unique advantages over others.
December 2, 2024
Mastering Sideways Markets With Auction Bars and Range Projections
November 19, 2024
Enhancing Your Automated Trading System: Key Insights from Best Pro Trade
November 14, 2024
NinjaTrader New Ecosystem Tools: October 2024 Edition
Enter Email for Updates