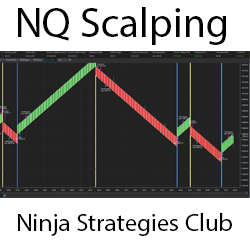
Open-source code can be developed. If you want, you can add different strategies on it. Lifetime free updates. Take-profit at three, five or seven ticks, stop-loss at 13 ticks. Change the take-profit and stop-loss settings.
Market Analyzer 96 Trade Systems is a framework of 96 easy-to-use trade systems to test market conditions. With this course you will be able to extend the provided framework and use it as a powerful tool for building trade systems.
This tool is the ultimate solution to help with your discipline and money management. This will display PNL in ticks or points on your chart, halt your ability to continue trading once you hit your risk limit and will ensure all orders are flattened before halting your trading. Free 7 day trial.
Manage your risk by setting drawdown limits and goals! If your drawdown limits are hit, the system prevents you from trading further. If your goal is hit, you can trade but never giving back more than your set amount. If hit, you're done for the day/week. This is your preset Dynamic Drawdown Limit.
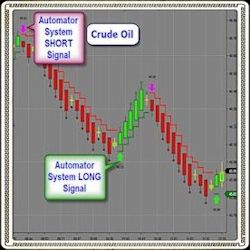
Automate your trade setups in real time with The Trade Automator! Backed by powerful built-in algorithms, the Trade Automator can help you become a more consistent trader, improve the timing of your entries & minimize emotional trading. Come see for yourself!
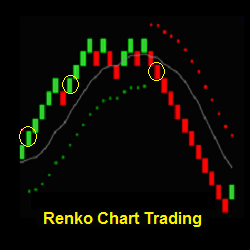
Renko Chart Trading offers day trading strategies, indicators and a training program focused on Renko charts. Learn the characteristics of how Renko charts can emphasize price, help filter chart noise and add clarity to trading. Join the Renko Trading Group today!
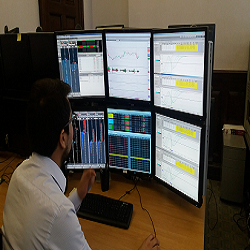
This is an intensive one-week course that by the end of the week will have you making confident trading decisions on various asset classes. If you have an inner trader we will find it. This course also includes a free trading challenge to qualify for a funded trading account.
Never Miss a Trade. The only live trading room that runs by very sophisticated bots. Join the rom and copy the bots trades 24/7.
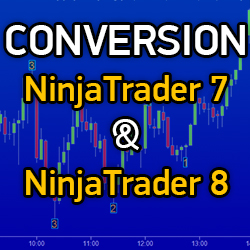
Emet Trading Solutions is a team of experienced programmers focused on trading. They offer strategy and indicator conversion from NinjaTrader 7 to NinjaTrader 8, or from NinjaTrader 8 to NinjaTrader 7. Their services include an individual approach and ongoing technical support. Get a free quote!
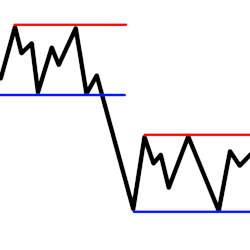
Created to help aid momentum-style charting in finding support and resistance lines. It was specifically made for the ES when plotted with tick bars. This tool may help cut down on chart preparation time or get your chart caught back up if busy multi-tasking.
December 2, 2024
Mastering Sideways Markets With Auction Bars and Range Projections
November 19, 2024
Enhancing Your Automated Trading System: Key Insights from Best Pro Trade
November 14, 2024
NinjaTrader New Ecosystem Tools: October 2024 Edition
Enter Email for Updates