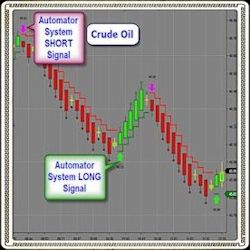
Automate your trade setups in real time with The Trade Automator! Backed by powerful built-in algorithms, the Trade Automator can help you become a more consistent trader, improve the timing of your entries & minimize emotional trading. Come see for yourself!
Innovation in Momentum: SPEARHEAD is a cutting-edge indicator for traders and investors. It compares the momentum of two instruments, with one being a custom synthetic instrument created by the user, incorporating up to seven assets like stocks, commodities, currencies, etc. Also in Spanish.
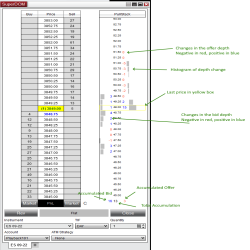
The Pull Stack Super DOM column shows you changes in the order book. There are several modes to this indicator to help give you a nuanced view and find the state of the market at each price level.
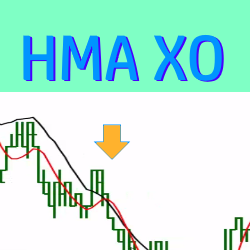
This trade setup indicator paints entry signals each time a Hull Moving Average (HMA) crossover occurs. The entry signals are customizable and can be filtered by the slope of the linear regression. Click here to watch a video and lean more!
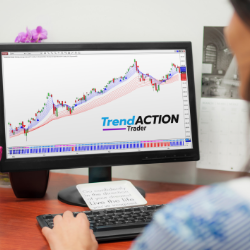
Trend Action Trader keeps you on the right side of the market with clear high probability signals for all markets and timeframes. Its price patterns and momentum algorithm are ideal whether you trade short or long term. Improve your trading consistency - try risk-free for 30-days!
Chompsky Fibs with Measured Moves: Auto plots the 61.8% zone and 38% zone with color changing for bias. Customizable Tags and signals for custom adoption from bots such as Trade Saber's Predator.
This fully-automated reactionary price and volume intraday trading strategy takes advantage of fluctuations of price, direction and momentum to currently trade the E-mini indices. We will be expanding into other futures, commodities and chart intervals in the near future.
The Job Pivot is a volume profile analysis that allows the user to gauge a directional bias with price targets. It provides an equilibrium between buyers and sellers for the purpose of identifying control of the session’s auction.
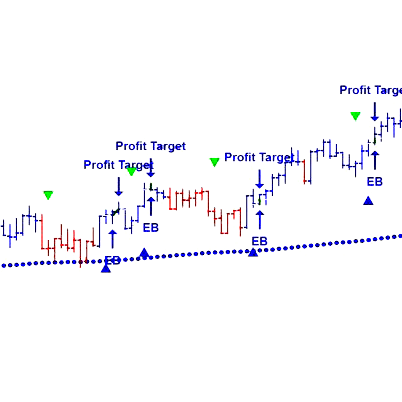
CommoditySignal is an essential trading signal app for commodity traders, offering precise signals for Crude Oil, Natural Gas, Gold, and Silver. Experience a 3-day free trial to see its effectiveness firsthand. Available on both iOS and Android, CommoditySignal delivers timely insights.
To compete at the elite level of intra-day liquidity providing, Boss Trading combines the two most effective development methods, mentoring and role modelling, to accelerate acquiring eighteen specific essential trading skills.
December 2, 2024
Mastering Sideways Markets With Auction Bars and Range Projections
November 19, 2024
Enhancing Your Automated Trading System: Key Insights from Best Pro Trade
November 14, 2024
NinjaTrader New Ecosystem Tools: October 2024 Edition
Enter Email for Updates