Discover our daily trading and investment newsletter service provided by the #1 Market Timer of 2018 as ranked by Timer Digest.
Are you busy but want to be consistent in the market? Do you want a strategy with fixed rules? Here, you get an automatic robot including an indicator and complete strategy, plus access to an internal Discord channel. Get started with a one-week free trial today over zoom, no installation needed!
Chicagostock Trading’s Pro membership includes a live trading room with real-time charts to view trading signals on ES and CL Futures. Members also receive a daily technical analysis report by email before market open with proprietary volatility windows and pivots. Ask about a 2-week trial today!
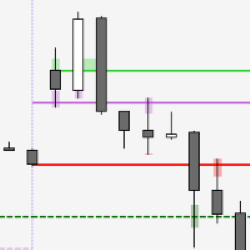
Watch price action at daily support and resistance levels in real time! Use the hourly open and EMA 20 as dynamic support and resistance. Detect reversals, trend attempts and breakout setups on the first three bars of the day. Get started with a free 30-day trial now!
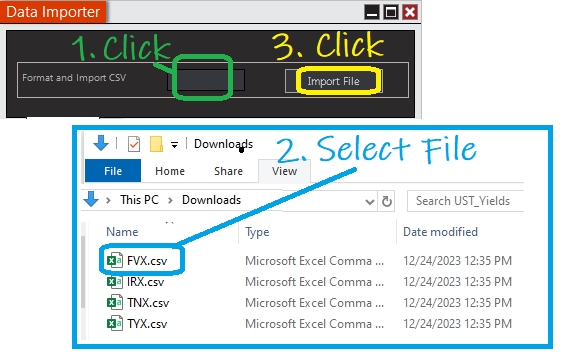
Quickly import any TXT or CSV data file into NinjaTrader for charting and analysis. Handles 450 different data formats. Historical price data, economic data and crop data can now be displayed inside NinjaTrader.
Prove you have what it takes to make money and we may fund you as a trader! We did it ourselves, we’ve done it for others, and we know we can help you, too. Learn. Get Funded. Trade! Come take the TradeDay Evaluation Challenge and get funded as a trader with our capital in live markets.
RTMC MNTrader is a fully automated trading system. Trading is based on Renko strategy using an exponential moving average. Filtering system based on the MACD and TMA Slope indicators. It has an improved position support system with flexible settings that will improve trading consistency.
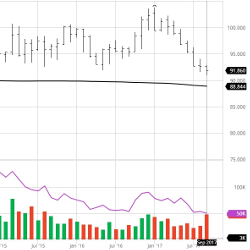
The Volume Weighted Average Price (VWAP) tells traders the average price for all transactions executed during a trading session, such as the current day, week, month or quarter. Many institutional traders execute based on the VWAP, so it is an important price benchmark to control transaction costs.
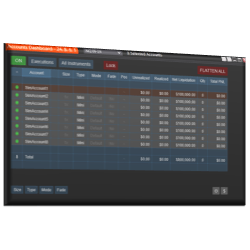
Duplicate Account Actions is the premiere NinjaTrader trade copier solution, built to keep all your positions and orders across all accounts in sync at all times. Finally, eliminate stress and challenges related to issues from other trade copier solutions!
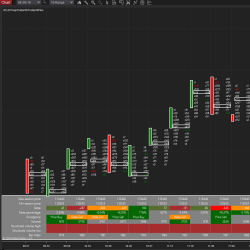
itcFootprint is an indicator for Order Flow and footprint. It displays data from the tape as footprint bars and also provides a statistic panel with powerful tools like delta analysis, divergence, volume structure, and unfinished business (bar by bar).
December 2, 2024
Mastering Sideways Markets With Auction Bars and Range Projections
November 19, 2024
Enhancing Your Automated Trading System: Key Insights from Best Pro Trade
November 14, 2024
NinjaTrader New Ecosystem Tools: October 2024 Edition
Enter Email for Updates