Universal Oscillator is an indicator that operates on the general principles of the RSI, CCI and OsMA oscillators. It helps you to identify potential upcoming reversals based on the values of the oscillator.
The Trading Accelerator Mentorship program caters to new and struggling traders trying to find their way. Trading support, troubleshooting, training and live trading sessions to bring traders up to speed on the business of trading.
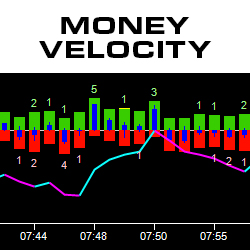
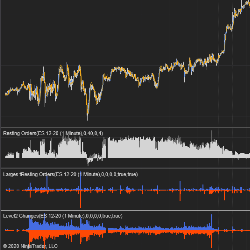
The Money Velocity indicator visually presents Time and Sales data. Easily see real-time bars featuring the number of sales at & above the ask price plus the number of sales at & below the bid price. Additionally, the indicator displays the difference, order flow trend and block trades. Learn More!
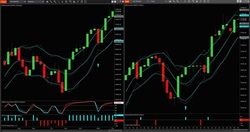
The indicator employs a proprietary algorithm, generating highly reliable signals in trending markets, leading to more confident trade decisions. The indicator's clouds move dynamically in tandem with market trends, offering a visually comfortable representation of market conditions.
edgeful breaks down market data into easy to read reports that instantly show you how any asset behaves, down to a specific weekday. They have all the breakdowns to tell traders when to size into a trade, when to size down, and even where to set your profit targets, based on the data, not opinions."
Confirm trend direction with this unique & proprietary indicator. It can be combined with any trading strategy to provide extra confirmation & is ideal for validating your open trades. It works out-of-the-box with no parametrization needed & detects Up and Down trends.
IAStealth signals the entry when the shorter time frame momentum has reversed back in the direction of the trend. More important is to know when the longer time frame momentum is showing signs of reversing. IAStealth alerts the shorter time frame after IAMomentum/IATrend alert the longer time frame.
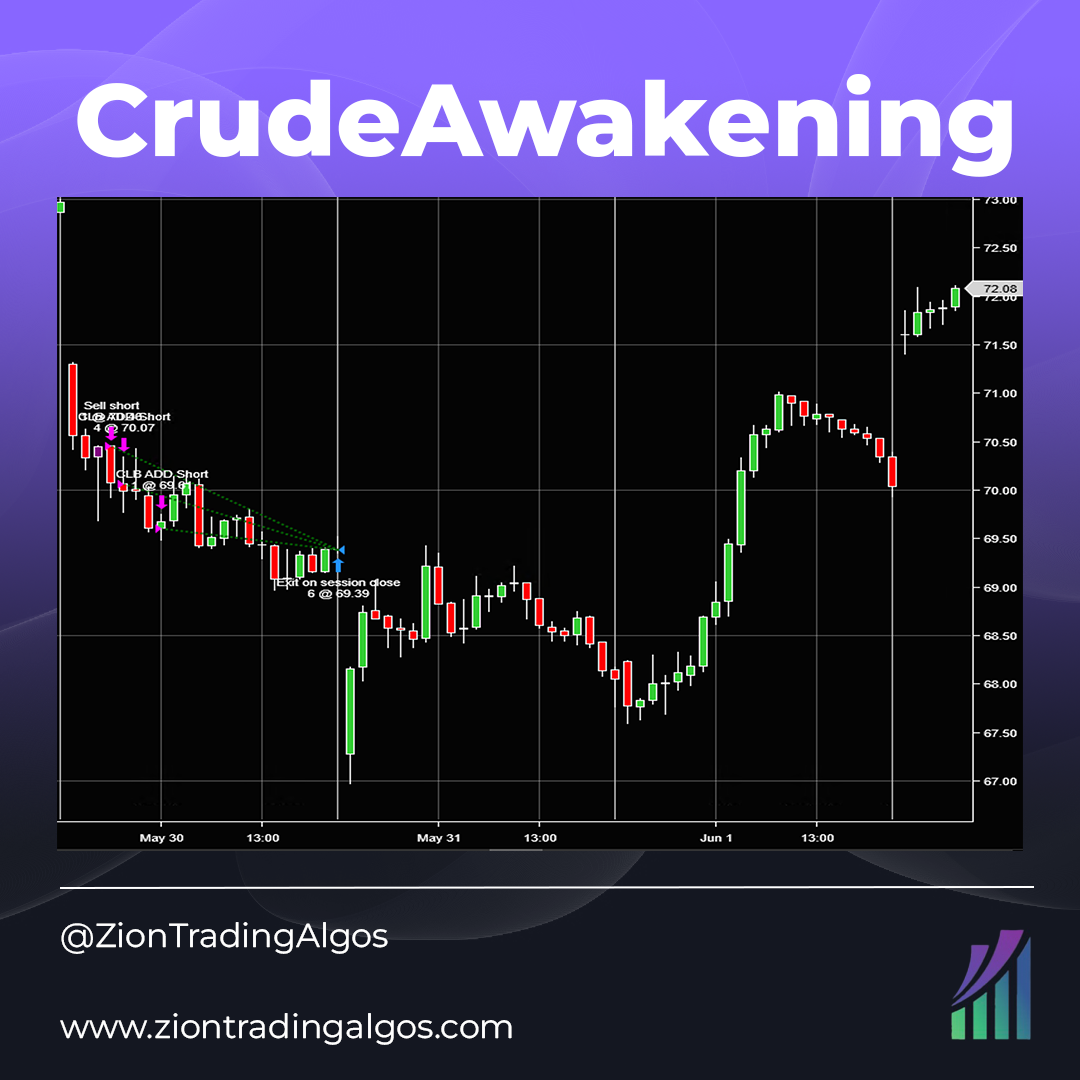
CrudeAwakening is an intraday CL system that trades on the 15-minute chart. It is a short only strategy.
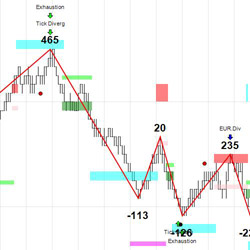
SpeculatorSeth's elite indicators use order flow and level 2 to give day traders and scalpers greater insight into current market conditions and market maker positioning. Includes spread charts to follow the yield curve and a synthetic dollar index.
ZoneTraderPro features unique support and resistance zones to match known market trading patterns along with intuitive real time tools to identify trade entries and exits. Nothing ever disappears from a ZoneTraderPro chart so you can create and test trading strategies.
December 2, 2024
Mastering Sideways Markets With Auction Bars and Range Projections
November 19, 2024
Enhancing Your Automated Trading System: Key Insights from Best Pro Trade
November 14, 2024
NinjaTrader New Ecosystem Tools: October 2024 Edition
Enter Email for Updates