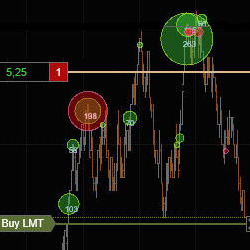
Would you like to see traders' emotions visualized right on a chart? Identify developing intraday reversals in real time, detect where retail traders place their stops and trade against them. Check historical data for solid setups. Get started with your 7-day free trial today!
Learn order flow trading from experienced full-time traders. We meet live multiple times each week - all meetings, clinics and workshops are recorded to our members library and you can interact 24x7 in our Slack group. We’re 100% focused on consistent trade setups and a FURU-free zone!
Unleash the power of automated trading with the Obsidian Indicator Suite for NinjaTrader 8. A collection of innovative indicators, including the Automated Dark Diamond Trend Sniper, specially designed for precision and adaptability in different market conditions. Start your 7-day free trial now!
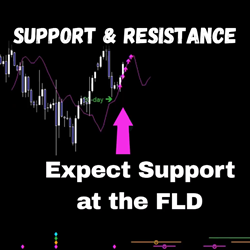
Perform an expert Hurst cycle analysis on any instrument/timeframe chart, and gain insight into hidden levels of support & resistance with accurate targets. Interactions between price & the Future Line of Demarcation (FLD) are identified for you, enabling anticipation of price action ahead of time.
One on one online consultations! Choose from a New Trader Strategy Meeting to begin your new journey as an online trader, to installing and setting up Bloodhound, BlackBird or the HeatMap Pro! Get started today!
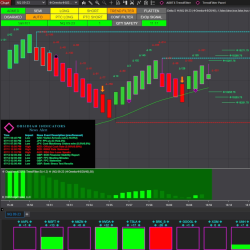
Rancho Dinero's full suite of Acme-brand volume, time, price and order flow analysis tools provide you everything you need to gain deep insight into your markets from multiple perspectives. Study your instruments. Strategize & define your risk. Stalk your trades and when opportunity knocks, strike!
George Douglass Taylor thoroughly studied the markets and developed a sophisticated strategy for trading them. His method has been handed down over the generations as the "Taylor Trading Technique" and is widely recognized as one of the most solid fundamental old school trading approaches.
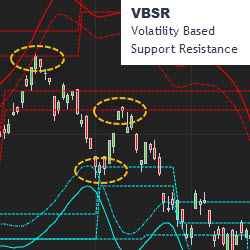
MetaSwing plots the hidden structure of support and resistance in real-time. VBSR (volatility based support resistance) makes this visible in advance, in all timeframes. Markets are non-linear and your tools should be as well. It’s not your father’s TA. Trial MetaSwing.
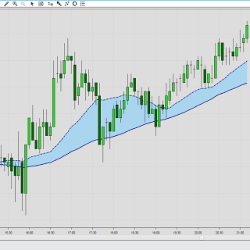
The Multiple MA Cross indicator plots a fast and a slow moving average. For both averages, users may select from over 30 different algorithms. The indicator can be used as a trend filter or for determining support and resistance.
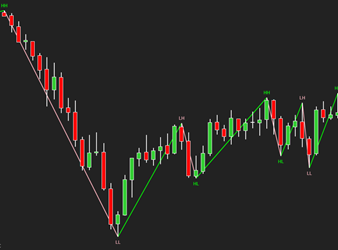
The ZigZag indicator is primarily used to identify significant highs and lows in the price chart, which helps traders filter out market noise and focus on important price movements.
December 2, 2024
Mastering Sideways Markets With Auction Bars and Range Projections
November 19, 2024
Enhancing Your Automated Trading System: Key Insights from Best Pro Trade
November 14, 2024
NinjaTrader New Ecosystem Tools: October 2024 Edition
Enter Email for Updates