Get the latest knowledge for independent traders to help them create custom tools, and processes and develop the mind needed for a successful trading career. Learn a unique technical analysis method and build trading strategies with a known edge, using a computer-based statistical approach.
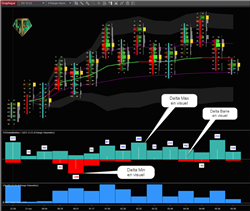
This indicator will visually tell you the evolution of this OrderFlow data: Delta / Delta Min / Delta Max. Ideal for detecting Delta divergences. No need to read the NinjaTrader statistics table anymore! Please note, you must have the NT8 version allowing access to OrderFlow.
Unlock the power of divergence in demand index with this simple to use translation of the interpretations of 20 different variants all combined in one. Often finds the exact peak of the day or week or month in real time. Newly released to join the other version on here. Works in any time frame.
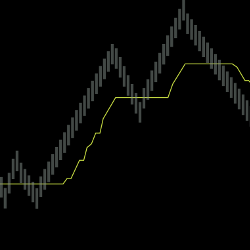
The LogikUltimateRenko is a completely customizable improved variant of the traditional Renko bar type. It has the added options to set the Open Price Relation (to the prior bar), as well as a more precise Reversal Brick Size control. Check out a video demonstration of LogikUltimateRenko in action!
100% FREE - The TAS Market Map Indicator delivers the most visually appealing customizable market profile tool for traders. Its color-coded sideways histograms clearly reveal volume at price, value areas (red zones), master point of control lines (aqua lines), gaps and congestion.
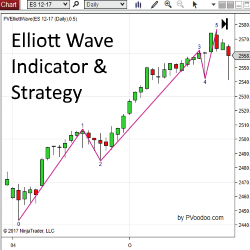
PVElliottWave Indicator is an Elliott Wave indicator designed for the NinjaTrader platform. Get started with a free trial of this indicator now!
MTM can trade multiple accounts, instruments (baskets) and orders (grids) simultaneously in one trade. Submit "stealthy" orders. Flexible stop-loss and profit targets. MTM Trendicator for Forex/crypto strength. Time-based trade exits. Monitor news. Save trade profiles for re-use. And much more!
Precision Volume Trading High Volume Indicator lets you know where the volume is being traded to trade with high liquidity.
Learn how to analyze the financial markets in this online trading course! The core methodology is based on supply and demand and institutional order flow principles. Unlimited access to multiple training formats are available including fun interactive quiz's. Enroll today!
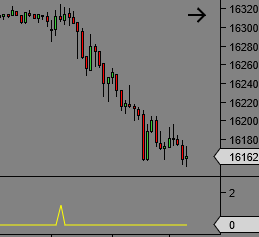
This NinjaTrader indicator is programmed to highlight the big money trades. The numbers are placed under each bar which makes it easy to see where the action/noise is taking place.
December 2, 2024
Mastering Sideways Markets With Auction Bars and Range Projections
November 19, 2024
Enhancing Your Automated Trading System: Key Insights from Best Pro Trade
November 14, 2024
NinjaTrader New Ecosystem Tools: October 2024 Edition
Enter Email for Updates