Choose from an assortment of indicators with enhancements not found anywhere else. (Digital Clock, Bar Timer, Divergence, Price Channel, Current Bar Range). Get free trials of these unique indicators now!
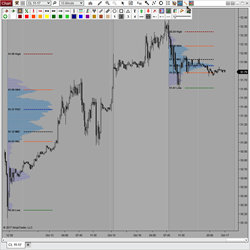
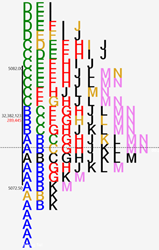
VPD is a custom drawing tool that dynamically draws volume profiles anywhere on your chart. It features 3 Modes of Calculation and displays 6 Levels of Significance (VPOC, VA's, High/Low/Mid) as well as a profile summary. It utilizes a unique context menu and is global drawing & template capable.
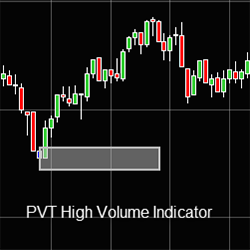
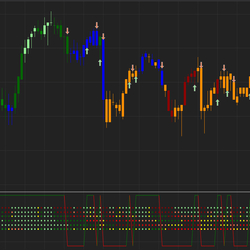
Precision Volume Trading High Volume Indicator lets you know where the volume is being traded to trade with high liquidity.
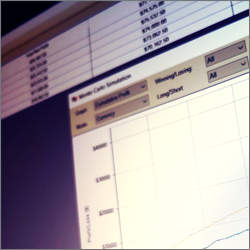
Use the experience of a quantitative trading system professional to help design, test, improve or optimize your trading strategy. Get a complete system analysis to have the confidence that your strategy performs exactly how it was designed to.
This is an introductory class that is perfect for beginners. It covers a multitude of topics including Technical Analysis and trading with custom indicators. Learn through one-on-one and group live zoom classes daily.
Advanced Trading Signals offers support to traders wishing to transform their trading concepts into workable indicators and fully automated strategies. They use best practices and leverage decades of programming experience to build and deploy solutions for traders of all types.
Nordman Algorithms provides indicator and strategy programming services. Indicators for trend identification, trade zone detection, news impact calculation, price pattern visualization & more can be built, as well as extendable, maintainable systems that follow your trade strategy.
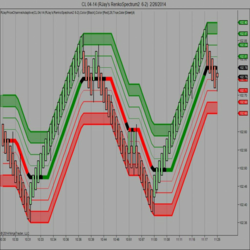
Next-generation support and resistance for active traders. Chartmap™ makes drawing lines on a chart a thing of the past by utilizing an innovative pattern finding algorithm to generate a heat map of powerful support and resistance. Upgrade your charts today with a 7-day free trial.
Upgrade to the silver plan for enhanced trading capabilities. Get all the features of the bronze plan plus the reference synchronizer module. The reference synchronizer indicator ensures seamless data flow between different charts, including market profile, daily, weekly and monthly charts.
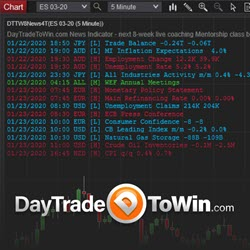
Download our FREE news indicator to see upcoming/scheduled financial news events plotted right on your chart. News events can cause sudden volatility and losing trades. Use this tool to stay informed. Watch the "Trading the News" video: https://daytradetowin.com/educational-trading-videos
December 2, 2024
Mastering Sideways Markets With Auction Bars and Range Projections
November 19, 2024
Enhancing Your Automated Trading System: Key Insights from Best Pro Trade
November 14, 2024
NinjaTrader New Ecosystem Tools: October 2024 Edition
Enter Email for Updates