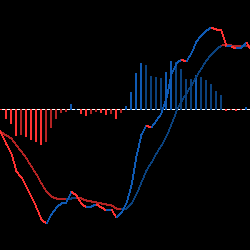
Our MACD Colours is The Prestige Trading Software’s own interpretation of a classic indicator, the MACD. Our version uses a price-reactive color scheme for the elimination of doubt, with everything to the long side turning blue and everything to the short side turning red. Try it for free.
Collect MAE/MFE data where NinjaTrader leaves off. Get the ability to measure your moves after you're out of the trade.
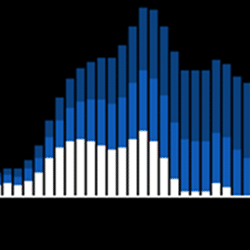
Take the guesswork out of trading waves with this set of indicators. You can now trade waves like a pro with this simple set of histograms. It will show you when a wave pattern starts and when it finishes. A great addition to any trend-following setup.
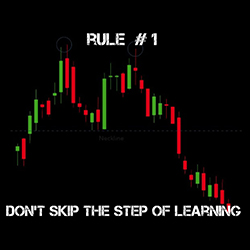
Gain an understanding of trading: market analysis, technical analysis, fundamental analysis, indicator trading, day trading/scalping, strategies, trading psychology, expectation and mindset, money management and risk management. Practice on a demo account. Referring trading brokerage/platform.
Enhance your trading strategy by visually delineating the Asia and London trading sessions on your charts. This powerful tool highlights the start and end times of these sessions, marks the high and low points, and extends these levels until the end of the New York regular trading session.
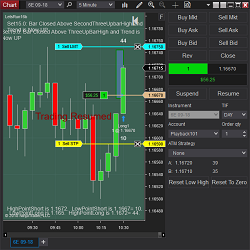
Let’s Run is a breakout strategy used for discretionary or automated trading with a Chart Trader switch. It triggers based on built-in trend finding indicators with customizable settings for stop options and reset buttons. It is fully flexible with both swing and scalp capabilities. Learn more!
See trade setups develop in real time in the Easy E-mini Trade Chat Room! Open Monday – Thursday 9:15 – 12:00 ET, sign up for your 3-day trial today!
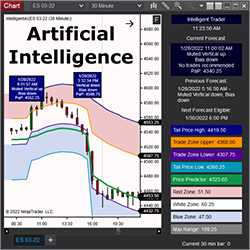
Intelligent AI uses a proprietary AIFS platform (Artificial Intelligence Forecast System). AIFS models are trained to learn the underlying structure of the market to forecast what may happen over the next six hours. Subscriptions also include access to Intelligent Trader's moderated Discord channel.
Unlock the power of fully automated NQ and MNQ futures trading with Steady Turtle. This advanced trend-following strategy adapts to market momentum and volatility, offering precise, emotion-free execution with robust risk management.
The SDP History offers multiple ways for the user to visualize the aggressive auction from session to session and monitor for continuation (Leroys) and turning points (Elbows).
December 2, 2024
Mastering Sideways Markets With Auction Bars and Range Projections
November 19, 2024
Enhancing Your Automated Trading System: Key Insights from Best Pro Trade
November 14, 2024
NinjaTrader New Ecosystem Tools: October 2024 Edition
Enter Email for Updates