Introducing a groundbreaking "Future Signal Zone" concept, the system predicts Support/Resistance zones ahead of the present price. With compatibility across different chart types, ZoneGPT * From The Future assures adaptability, addressing both trend riding and pinpointing reversals.
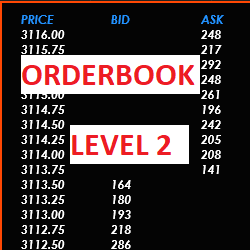
itcOrderBook is a Ninja Trader 8 indicator that displays the order book for the current asset (market depth or level 2). Ask & Bid are displayed on the price ladder and colors & text size can be customized at will. Users can set the location X,Y where the box will display.
The HolyGrail Algo uses calculations of the Hull Exponential Moving Average to identify market direction. A long or short condition is printed on the chart showing the potential direction an instrument may move. HolyGrail mainly uses it for indices, but it works with any market and any timeframe.
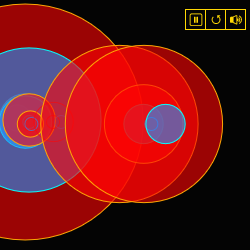
Hear, see and feel the market! A multi-sensory, audio-visual experience of reconstructed trades being executed at every moment. It uses high-performance audio processing technology and an uncluttered visual representation of each trade to give a sense of the pace and size hitting the tape.
A unique course with a specific, rule-based & mechanical/objective trading methodology. Designed to help traders identify entries & exits, define size, manage risk and control emotions when trading Equity Markets with their own characteristics & terminology. Get FREE access to the patented AutoUFOs®
The Spread Trading Tool add on for NinjaTrader 8 allows for charting a variety of spread combinations from 2 leg 1:1 ratio spreads to more advanced butterfly spreads. A control panel connected to the strategy allows for easy entry and management of spread trades.
The Oil Trading Room is a product of Robbins World Cup Champion Trader Rob Mitchell. It has a unique Scientific approach with Trading Signals, Indicator applications using Market Profile, Price Action, Order Flow, Momentum, Order Flow Momentum, Support Resistance, Market Mapping and more.
High performance, fully-automated night and day trading for NQ and MNQ. The VX9 wakes up before sunrise and finds the best trading opportunities in the morning twilight. Built from scratch to be a true day trading system, the VX9 offers simplicity and performance.
When MFI, RSI, and Stochastic converge, the background is colored, signifying the overlapping zone and triggering immediate alerts via chart markers. This visually appealing and efficient tool excels beyond conventional oscillator applications, optimizing chart space for essential information.
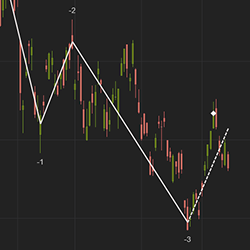
The Wave indicator is similar to an Elliot Wave with an added capability to forecast a possible market reversal. It has convenient features including the ability to number waves to help identify trend direction.
December 2, 2024
Mastering Sideways Markets With Auction Bars and Range Projections
November 19, 2024
Enhancing Your Automated Trading System: Key Insights from Best Pro Trade
November 14, 2024
NinjaTrader New Ecosystem Tools: October 2024 Edition
Enter Email for Updates