The VTP was created to provide Veterans with an introduction to financial markets. The Stage 5 Online Course educates traders on how to approach their funding challenges within the Prop Firm space. It aims to helping support traders to succeed, and build a sustainable trading business.
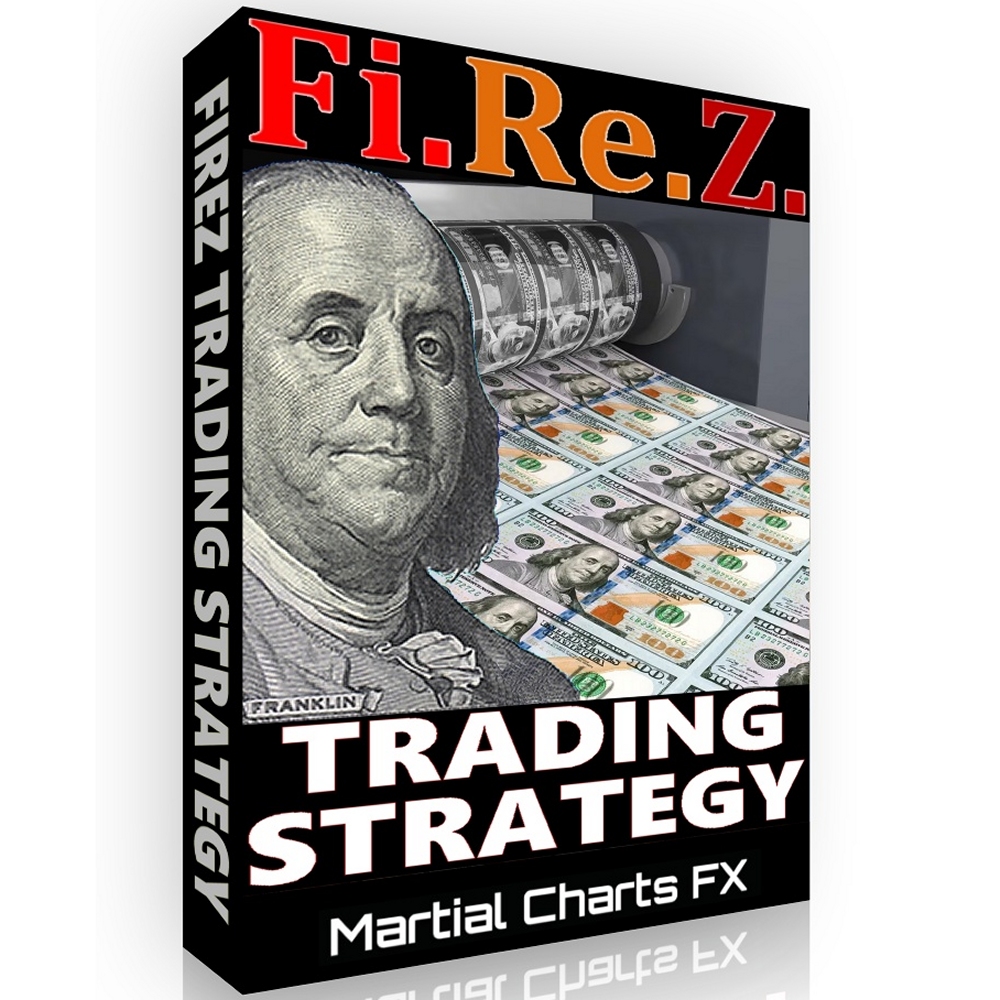
The FiReZ Trading Strategy is an original and modern refinement of Fibonacci technical analysis. This Fibonacci trading strategy may be the last strategy that you'll need to learn. Stop making trading complicated and learn how to analyze and trade in a simplified, structured, and repeatable system.
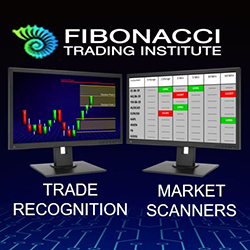
Trade like a pro with the proprietary Alpha Fibonacci System, traded globally by traders of all levels & instruments since 2011. The lifetime system includes Multi Market Scanners with group or private mentoring courses and a video library, modules and trading room included. [email protected]
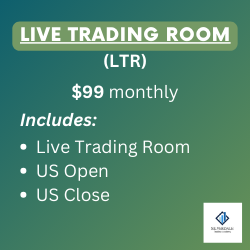
Join this team of professional traders and mentors as they identify trades in real time (US / open & close NQ & ES).
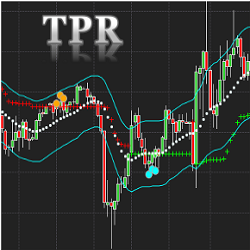
The Trend Pullback Reversal (TPR) Indicator displays possible price trends with pullback and reversal signals. TPR will focus on the main trend and filter out most minor price movements. The NinjaTrader 8 version comes with a unique band and center line as additional features.
This savvy tool is for any intraday trader who draws lines and prizes accuracy when plotting, templating and reviewing line break information across multiple intraday timeframes. Our template tool also features the 5 standard next-gen and time saving features of the CT_Signature Fan Series.
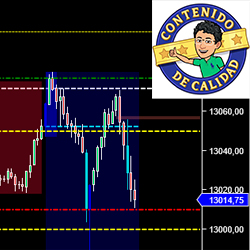
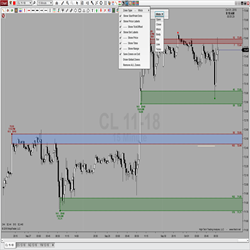
Análisis de mercados americanos una hora antes de la apertura: Futuros de Nasdaq (NQ y MNQ), S&P (ES y MES), Dow Jones (YM y MYM), Russell (RTY y M2K), Petróleo (CL y MCL) y Oro (GC y MGC). Determinación de niveles de compra y venta con Price Action y Smart Money.
Trade with the best conditions in order to become an extraordinary trader, follow the risk management rules and reach your target in as little as 10 days. Once you have completed the target, we will connect you with one of our funding partners.
Creating, displaying & saving levels of interest could not be easier! Simply double click above or below any bar to automatically add or remove zones. This features 8 unique Zone Types, a right click context menu & toolbar icon for simple configuration, and is global drawing & template capable!
Next-generation support and resistance for active traders. Chartmap™ makes drawing lines on a chart a thing of the past by utilizing an innovative pattern finding algorithm to generate a heat map of powerful support and resistance. Upgrade your charts today with a 7-day free trial.
December 2, 2024
Mastering Sideways Markets With Auction Bars and Range Projections
November 19, 2024
Enhancing Your Automated Trading System: Key Insights from Best Pro Trade
November 14, 2024
NinjaTrader New Ecosystem Tools: October 2024 Edition
Enter Email for Updates