Indonesian-speaking. This channel is a place to learn forex, crypto and stock trading using ICT methods. Make daily analysis, design trading plans correctly and measurably.
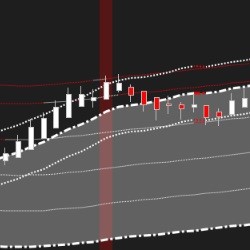
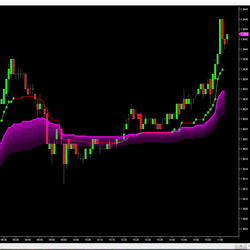
The Linear Regression Trend Lines Indicator dynamically balances the trend on your chart on all time frames. This indicator is built from several linear regression indicators and modified Keltner Channels. Set up to five offset multiplier levels for targets or reversals.
FREE indicators and workspaces to follow along with Horst's YouTube tutorials and videos. Check out live daily YouTube trades on the website & discover the ability to see upcoming moves clearly & logically before they happen. Download the free workspaces & indicators today!
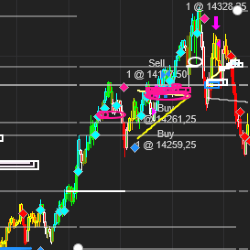
Q-Scalper indicator identifies the confluence dynamics between Support and Resistance levels with significant Trendlines, providing very significant trade levels. These levels produce very actionable and valuable trade set-ups. Click the link to explore this great indicator.
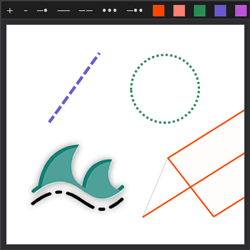
This indicator allows the user to change the color, stroke style and stroke size of drawn objects on the fly without having to dig through various menus. This increases application functionality and user charting efficiency.
edgeful breaks down market data into easy to read reports that instantly show you how any asset behaves, down to a specific weekday. They have all the breakdowns to tell traders when to size into a trade, when to size down, and even where to set your profit targets, based on the data, not opinions."
It is not always easy to quickly determine the size of a bar by looking at the price axis. BarSizeCounter allows you to instantly observe the size of the bar and how far the current price is from its high and its low.
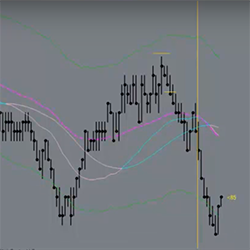
DTB River is an implementation of DTB Waves on non-time based charts and the results are plotted on time-based charts. It provides an added layer of noise filtering for waves. During the consolidation phase DTB River flattens out.
Market Volatility Harvester™ is a fully automated trading system that uses quantitative & technical trading strategies to only trade E-Mini S&P 500 futures. The automated trading system looks for long & short trade setups. Get Mach 1 trial version automated trading system today, backtest it to 2008!
TrendHunter is an EMA based intraday strategy on the 5 minute chart. It has a built-in volatility centric model. It performs well on trending days in the market, and is designed to reduce risk and take a smaller position size if the market is not in a trend.
December 2, 2024
Mastering Sideways Markets With Auction Bars and Range Projections
November 19, 2024
Enhancing Your Automated Trading System: Key Insights from Best Pro Trade
November 14, 2024
NinjaTrader New Ecosystem Tools: October 2024 Edition
Enter Email for Updates