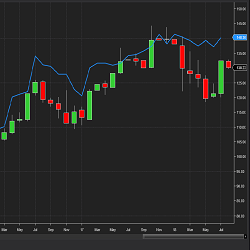
The StockCalcValuation indicator displays a fundamental valuation for the company you are examining. At StockCalc we value 8000 companies each night using 6 valuation models or data points and determine a Weighted Average Valuation from these calculations for display. Get your free trial now!
Subscribe to the Quaderr newsletter and receive updates on their new products! You will also qualify for great discounts and gain access to five free indicators.
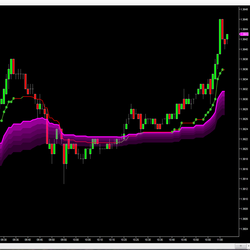
DTB River is an implementation of DTB Waves on non-time based charts and the results are plotted on time-based charts. It provides an added layer of noise filtering for waves. During the consolidation phase DTB River flattens out.
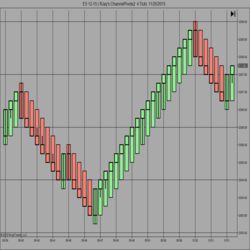
Pick from 8 different bar charts, offering features found nowhere else. Customized renko, range, tick, and time-based charts are available. Most charts have unique chart styles included (classic candle, price action, and xray). Get a free trial now!
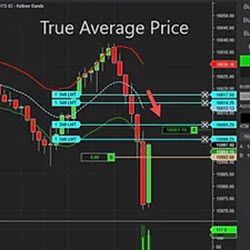
Discover accuracy with the True Average Price Indicator. Move beyond FIFO methods and accurately track your average price on NinjaTrader. This tool provides real-time insights into your position's average cost, enabling smarter trading decisions. Elevate your strategy with informed precision.
Never Miss a Trade. The only live trading room that runs by very sophisticated bots. Join the rom and copy the bots trades 24/7.
KaseX is a symbol based technical analysis trading study with a simple, uncluttered display. KaseX captures dozens of complex technical signals in multiple time-frames. Variable optimization is unnecessary as pre-configured sensitivity settings are built in. Take a free 30-day trial today!
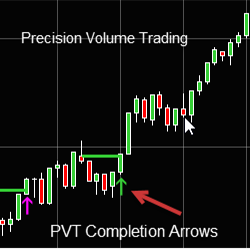
Precision Volume Trading Completions Arrows helps traders determine if the market will move up or down.
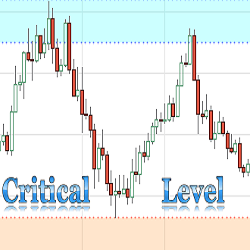
The purpose of this indicator is to automatically plot critical support and resistance levels on a chart. The Critical Support & Resistance Level Indicator comes with customizable alerts and can be added as a Market Analyzer column.
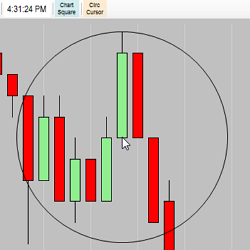
Need a quick way to measure X ticks from the cursor, for free? The IT_CircCursor is just that type of bare bones tool. Set the ticks in the parameters and click the toolbar button to activate. There are many free indicators to choose from, visit Integrity Traders today to learn more!
March 25, 2024
Trading Pullbacks and Reversals: Simplifying a Once Complex Retail Trading Strategy
March 21, 2024
VWAP Indicator: Average Price Shown Based on Price, Volume
March 18, 2024
Trade Copier Strategies: Make Efficiency Work for You When Futures Trading
Enter Email for Updates