Learn from 25+ chapters that take you from A-Z, showing traders three go-to entry signals that are seen on all time frames. Join for lifetime access, yearly updates, VIP Discord access, live morning analysis stream, and more!
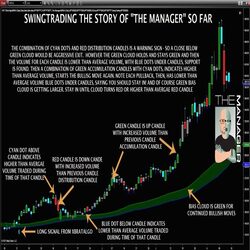
The Manager helps with simple and repeatable trade management. Using a number of tools like average volume, volume distribution or accumulation and an adjustable BIAS cloud, it can help you evaluate whether the market is reversing or just pulling back.
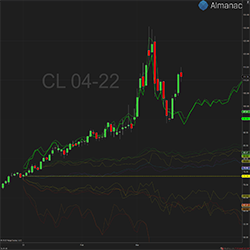
Accrue Inc. didn’t invent seasonality – they just made it easier to see and trade! Almanac™ Calendar Analytics creates better awareness of seasonality with 90-day price projections across five different market scenarios.
ZoneVue Pro, an advanced Supply & Demand Indicator, giving you the edge you've been looking for! Identify quality zones from price action to order flow, identifying pending orders from banks and intuitions. No lagging indicators. Trade like a sniper. Transform your trading!
We offer programming services for users of NinjaTrader. Our expert IT professionals will be glad to work on your most ambitious projects. We specialize in programming strategies based on Order Flow, Market Profile and VWAP to automate trading as a mechanical system.
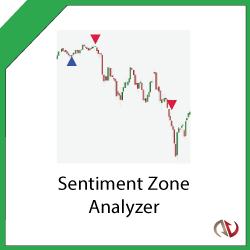
Use the Sentiment Zone Analyzer to measure overall market sentiment to spot trend reversals early! Based on the premise that extremely bullish or bearish tendencies will eventually lead to trend reversals. Dynamically calculates overbought and oversold levels based on previous price action.
Classic MA MNTrader is a fully automated trading system. Trading is based on the moving averages indicator for two classic signals on our developed system of support positions with flexible settings. Suitable for all futures and Forex trading instruments.
Market Analyzer Column: Effortlessly tailor real-time market data to your needs.
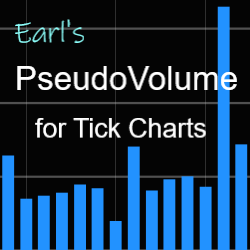
Earl's PseudoVolume Indicator displays relative volume for each bar of a tick chart, making anomalous activity spikes much easier to spot. Trade with more confidence and without wasting time checking a time-based chart whenever you get an entry signal and suspect anomalous activity.
TS Custom Analysis is precise support and resistance based custom technical analysis in the style of TS TradePlan. Analysis can be done for markets specified by clients. Email TraderSmarts today for a free quote.
December 2, 2024
Mastering Sideways Markets With Auction Bars and Range Projections
November 19, 2024
Enhancing Your Automated Trading System: Key Insights from Best Pro Trade
November 14, 2024
NinjaTrader New Ecosystem Tools: October 2024 Edition
Enter Email for Updates