When MFI, RSI, and Stochastic converge, the background is colored, signifying the overlapping zone and triggering immediate alerts via chart markers. This visually appealing and efficient tool excels beyond conventional oscillator applications, optimizing chart space for essential information.
Automated trading for the S&P 500, Indices, ETFs, Stocks and Cryptocurrencies. Discretionary trading indicators. The RD3 uses a two stage system for identifying profitable swing trading opportunities.
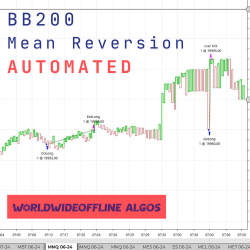
The original BB200 mean reversion strategy is designed for NQ/MNQ, on their specific Kagi set charts. BB200 can be deployed on any pair of your choice, not just NQ/MNQ. Backtesting is suggested before use. They like to run the strategy on ES/MES, as well. BB200 utilizes a trend filter.
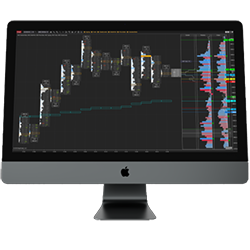
A comprehensive indicator suite for order flow and volume analysis. MarketProfile charts show the bigger picture, BookFlow visually displays the real time and historical order book and Footprint charts reveal the aggressive side of the market. Trade room access and a 14-day free trial are included.
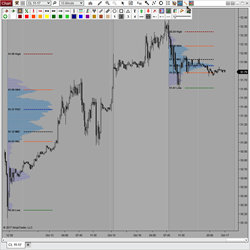
VPD is a custom drawing tool that dynamically draws volume profiles anywhere on your chart. It features 3 Modes of Calculation and displays 6 Levels of Significance (VPOC, VA's, High/Low/Mid) as well as a profile summary. It utilizes a unique context menu and is global drawing & template capable.
Trade Pro trading indicators: Specifically designed for trading the 5 minute charts, the TradePro indicators offer at-a-glance volume and volatility indicators, a trend indicator, candle strength indicators, institutional brickwall indicators, along with a candle timer.
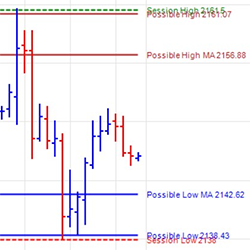
TTT Range Indicator plots the data from the TTT E-book directly on NinjaTrader Charts. Determine the range of an instrument prior to potential reversals, and the average once the high and low for the day is recorded. Learn more!
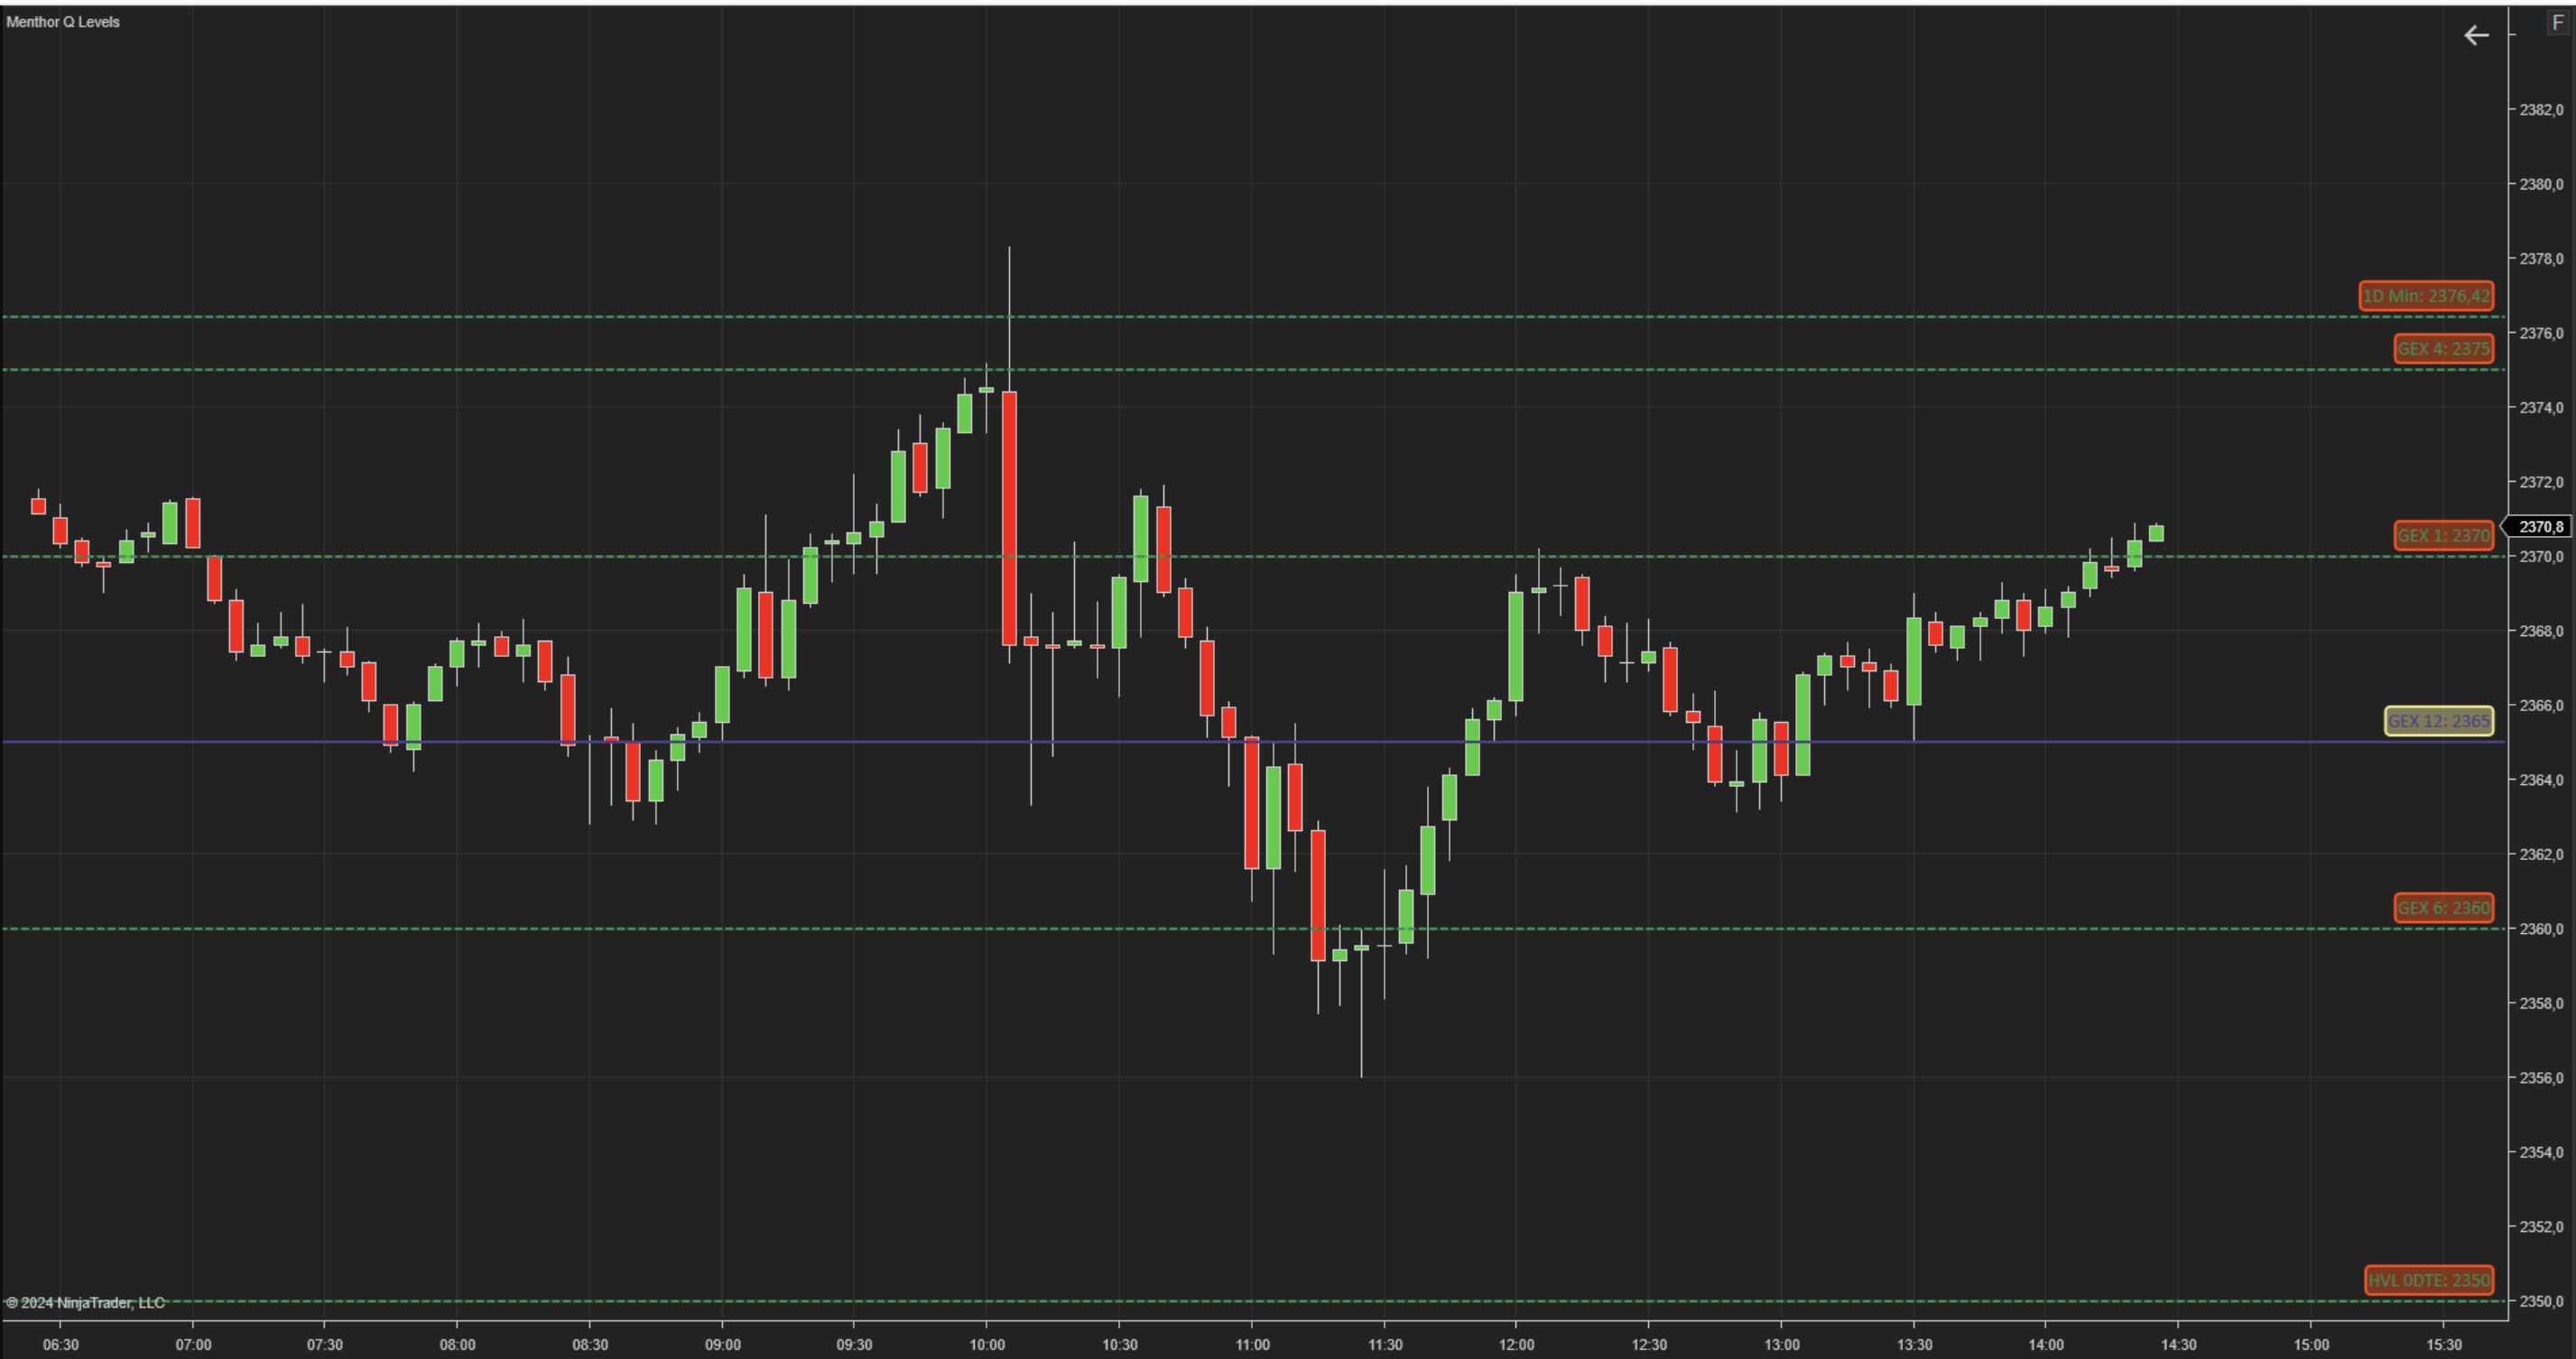
The Menthor Q-Levels indicator for NinjaTrader revolutionizes trading by deriving key levels and market reaction zones directly from options data. Seamlessly integrated into your chart, this innovative tool provides traders with precise and actionable levels that enhance decision-making.
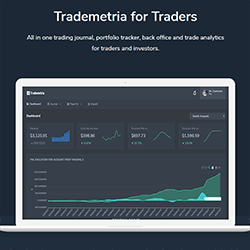
This all-in-one trading journal, portfolio tracker and trade analyzer software helps traders and investors make better trading decisions based on statistical evidence. Better trading starts with better data.
Stay in your trades for longer using our HeatMap indicator. One of the toughest problems can be getting into a trend or staying in a trend until the end. HeatMap looks at 4 factors which determine a trend and displays the results in an easy-to-read heatmap right on your charts.
December 2, 2024
Mastering Sideways Markets With Auction Bars and Range Projections
November 19, 2024
Enhancing Your Automated Trading System: Key Insights from Best Pro Trade
November 14, 2024
NinjaTrader New Ecosystem Tools: October 2024 Edition
Enter Email for Updates